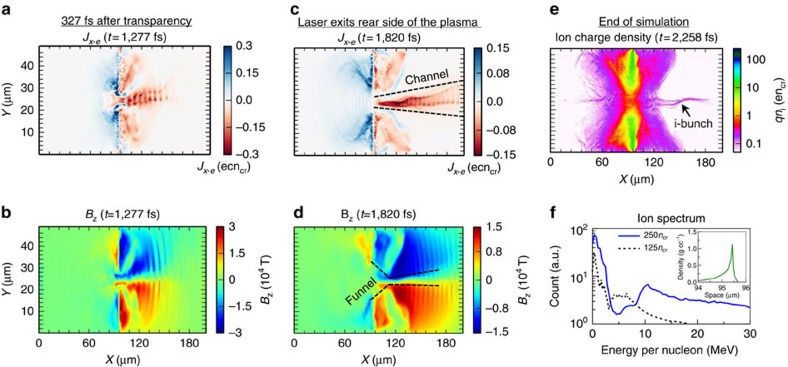
Figure 6. Overview of 2D VPIC simulation results from f/1.5 laser focus onto pre-expanded 250-nm-thick aluminium foil.
(a) Longitudinal electron current density (Jx−e); (b) Self-generated azimuthal magnetic field (Bz) in the plasma at t=1,277 fs showing the forward electron jet. Plasma transparency occurs at 950 fs; (c) Longitudinal electron current density (Jx−e); (d) Self-generated azimuthal magnetic field (Bz) in the plasma at t=1,820 fs when the laser exits the rear side of the plasma; (e) Final plasma ion charge density profile at the end of the simulation at t=2,258 fs with corresponding ion jet; (f) Final ion energy spectrum (solid blue line) with a dominant spectral peak at 10.6 MeV per nucleon; inset shows the pre-expanded plasma profile from 250-nm-thick aluminum foil that was used as input to the VPIC simulation. Dashed black line shows the ion energy spectrum with inferior spectral peak ∼5 MeV per nucleon from a simulation of non-optimal onset of relativistic transparency.

