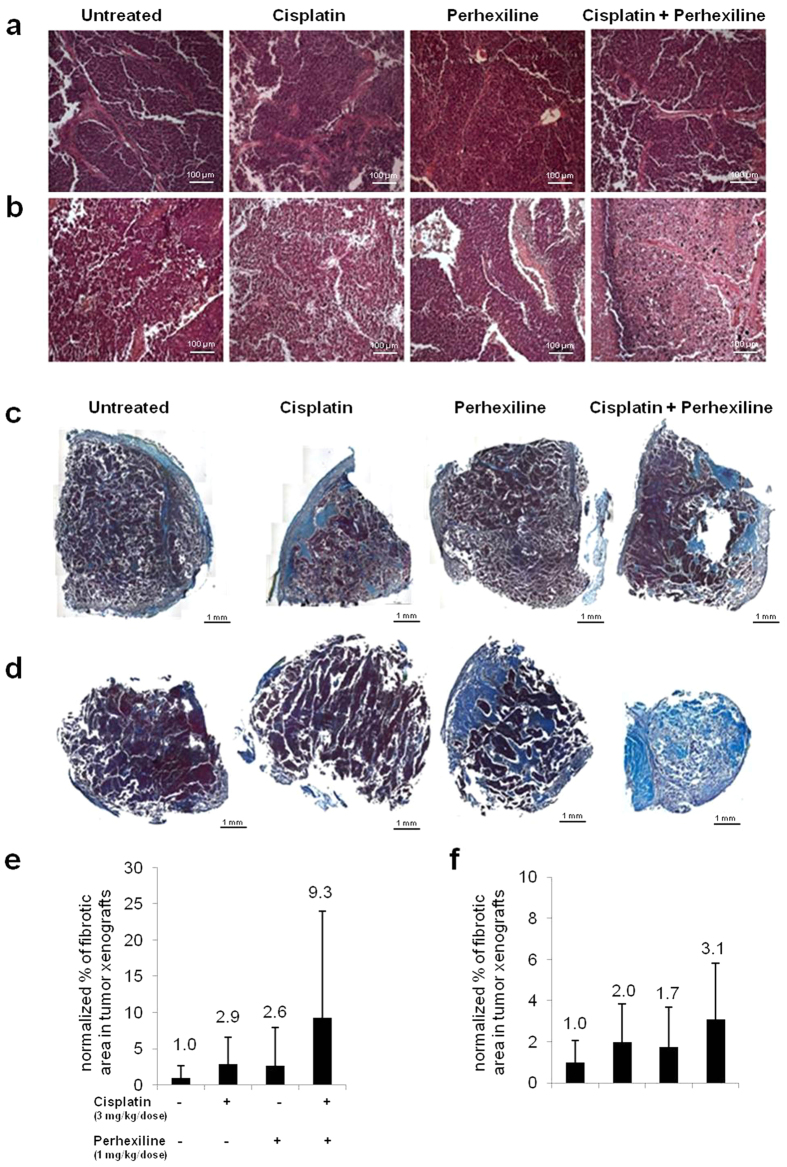
Figure 4. Perhexiline increases in vivo cisplatin cytotoxicity in a NB mouse model.
Representative light microscopy images of haematoxylin/eosin stained sections of subcutaneous tumours in treated and untreated mice, in protocol a (vehicle, Perhexiline 1 mg/Kg/dose and/or Cisplatin 3 mg/Kg/dose) (a) and b (vehicle, Perhexiline 3 mg/Kg/dose and/or Cisplatin 5 mg/Kg/dose) (b). Scale bar: 100 μm. Representative images of treated and untreated tumours, stained by Mallory’s trichrome (magnification 20×), from protocols a (vehicle, Perhexiline 1 mg/Kg/dose and/or Cisplatin 3 mg/Kg/dose) (c) and b (vehicle, Perhexiline 1 mg/Kg/dose and/or Cisplatin 3 mg/Kg/dose) (d). Scale bar: 1 mm. Mean fibrotic area in tumour specimen from each mouse from protocols a (e) and b (f) was reported as histograms.

