
Fig. 3.
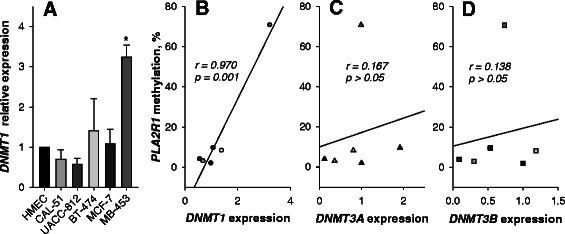
Expression of DNMT1 (a) and correlation of DNMT transcript levels with PLA2R1 gene methylation degrees (b–d) in HMEC and mammary cancer cell lines. a Bar graphs show the relative levels of DNMT1-specific mRNA determined using real-time RT-PCR and GAPDH mRNA levels were used as reference gene. The comparative values were normalized to levels of DNMT1 expression in HMEC that was set at 1.0. Results are shown as means ± SD. Analyses were performed in duplicates and results are representative of three independent experiments. * - p < 0.05 relative to HMEC value. b–d Data represent scatter-regression plots of correlation between PLA2R1 promoter methylation and DNMT1 (b), DNMT3A (c) and DNMT3B (d) expressions in HMEC and mammary cancer cell lines. Values of Pearson product moment correlation coefficient (r) between DNMT expression and PLA2R1 promoter methylation are shown