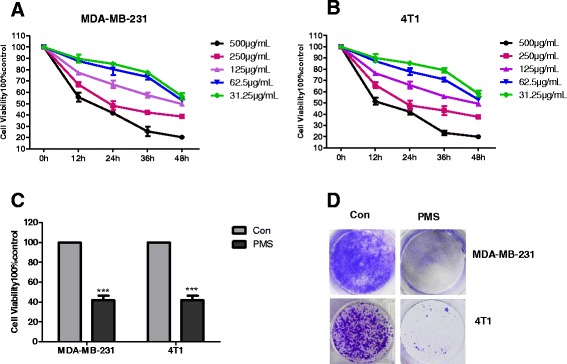
Fig. 2.

Cell viability decreased after treatment of PMS. Cell viability was analyzed using Cell Counting Kit 8 at 0, 12,24,36,48 h after 31.25, 62.5, 125, 250, 500 μg/m L PMS treatment in (a) MDA-MB-231 and (b) 4T1 cells. c Cell viability was detected after 36 h 250 μg/mL PMS treatment. Data represent the mean ± S.D. of three independent experiments. d Colony formation of MDA-MB-231 and 4T1 cells. Cells were treated with 100 μg/mL PMS for 36 h, followed with crystal violet staining of attached cells at 10 days. Similar results were obtained from independent experiments. The *** indicates extremely significance different
