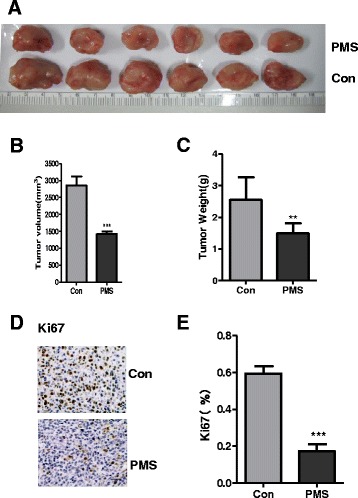
Fig. 5.

The antitumor effect of PMS treatment in vivo. Mice were injected s.c. with 1.5 × 10⁶ 4T1 cells. a–c The fifth day after the injection, mice were treated daily with PMS at 200 mg/kg by oral gavage for 21 consecutive days. a Representative tumors at the end of the experiment, (b) tumor volume, (c) tumor weight at indicated time points after treatment was calculated. d Paraffin-embedded sections of control or treated tumor tissues from mice were analyzed by Ki67 IHC staining. e Quantitative analysis of Ki67 staining corresponding to the images in d. Data represent the mean ± S.D. of three independent experiments. Scale bar = 25 μm. The ** indicates significance different. The *** indicates extremely significance different
