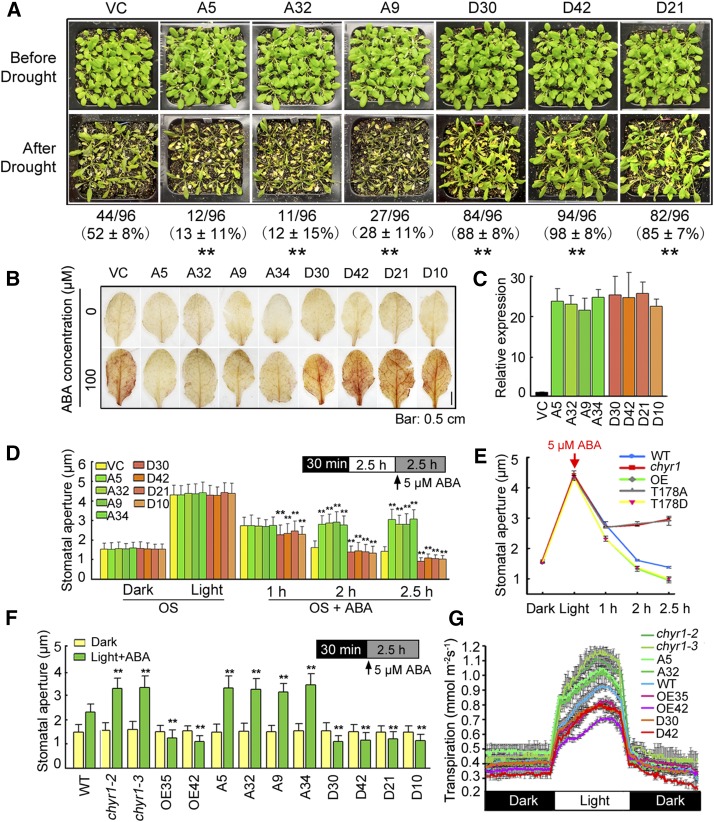
Figure 6.
Analysis of 35S:CHYR1T178A and 35S:CHYR1T178D Transgenic Plants in Comparison to chyr1 Mutants and 35S:CHYR1 Plants.
(A) Drought tolerance of 35S:CHYR1T178A and 35S:CHYR1T178D plants. Water was withheld from 28-d-old plants for 14 d. A5, A32, and A9, and D30, D42, and D21 denote 35S:CHYR1T178A transgenic lines 5, 32, and 9, and 35S:CHYR1T178D transgenic lines 30, 42, and 21, respectively. Photographs were taken after 3 d of rewatering. Values represent means ± sd from three biological replicates. Statistical significance between VC and the transgenic lines was determined by a t test: *P < 0.05 and **P < 0.01.
(B) DAB staining of VC, 35S:CHYR1T178A, and 35S:CHYR1T178D leaves. A34 and D10 denote 35S:CHYR1T178A transgenic line 34 and 35S:CHYR1T178D transgenic line 10, respectively. The red-brown staining indicates H2O2 accumulation. Representative photos are shown. Bar = 0.5 cm.
(C) Relative expression of CHYR1 in the 35S:CHYR1T178A and 35S:CHYR1T178D lines analyzed by qRT-PCR. Expression of CHYR1 in the wild type was defined as 1.0. Values represent means ± sd (n = 3) from three technical replicates.
(D) ABA-induced stomatal closure in wild-type, 35S:CHYR1T178A, and 35S:CHYR1T178D plants. Leaves from 4-week-old plants were incubated in OS in the dark for 30 min. After exposure to light for 2.5 h, 5 μM ABA was added to the samples to observe the stomatal closure at 1, 2, and 2.5 h of ABA treatment. Data were obtained from ∼100 stomata for each sample. The error bars were obtained from different stomata. Values represent means ± sd (n > 100) from three to five biological replicates. Statistical significance between VC and the transgenic lines in each treatment was determined by a t test: *P < 0.05 and **P < 0.01.
(E) A comparison of ABA-induced stomatal closing among the wild type, the chyr1 mutants, and 35S:CHYR1, 35S:CHYR1T178A, and 35S:CHYR1T178D plants.
(F) ABA-inhibited light-induced stomatal opening in the wild type, the chyr1 mutants, and 35S:CHYR1, 35S:CHYR1T178A, and 35S:CHYR1T178D plants. Leaves from 4-week-old plants were incubated in OS for 30 min in dark and then transferred to the light in the presence of 5 μM ABA for 2.5 h. Data were obtained from ∼100 stomata for each sample. The error bars were obtained from different stomata. Values represent means ± sd (n > 100) from three to five biological replicates. Statistical significance between the wild type (comparable with VC) and chyr1 mutants or the transgenic lines in each treatment was determined by a t test: *P < 0.05 and **P < 0.01.
(G) Transpiration rates in 8-week-old plants grown under an 8-h-light/16-h-dark photoperiod were determined by gravimetric analysis. Water loss was measured as weight change at 5-min intervals over 24 h (means ± sd, n = 3).

