Figure 2.
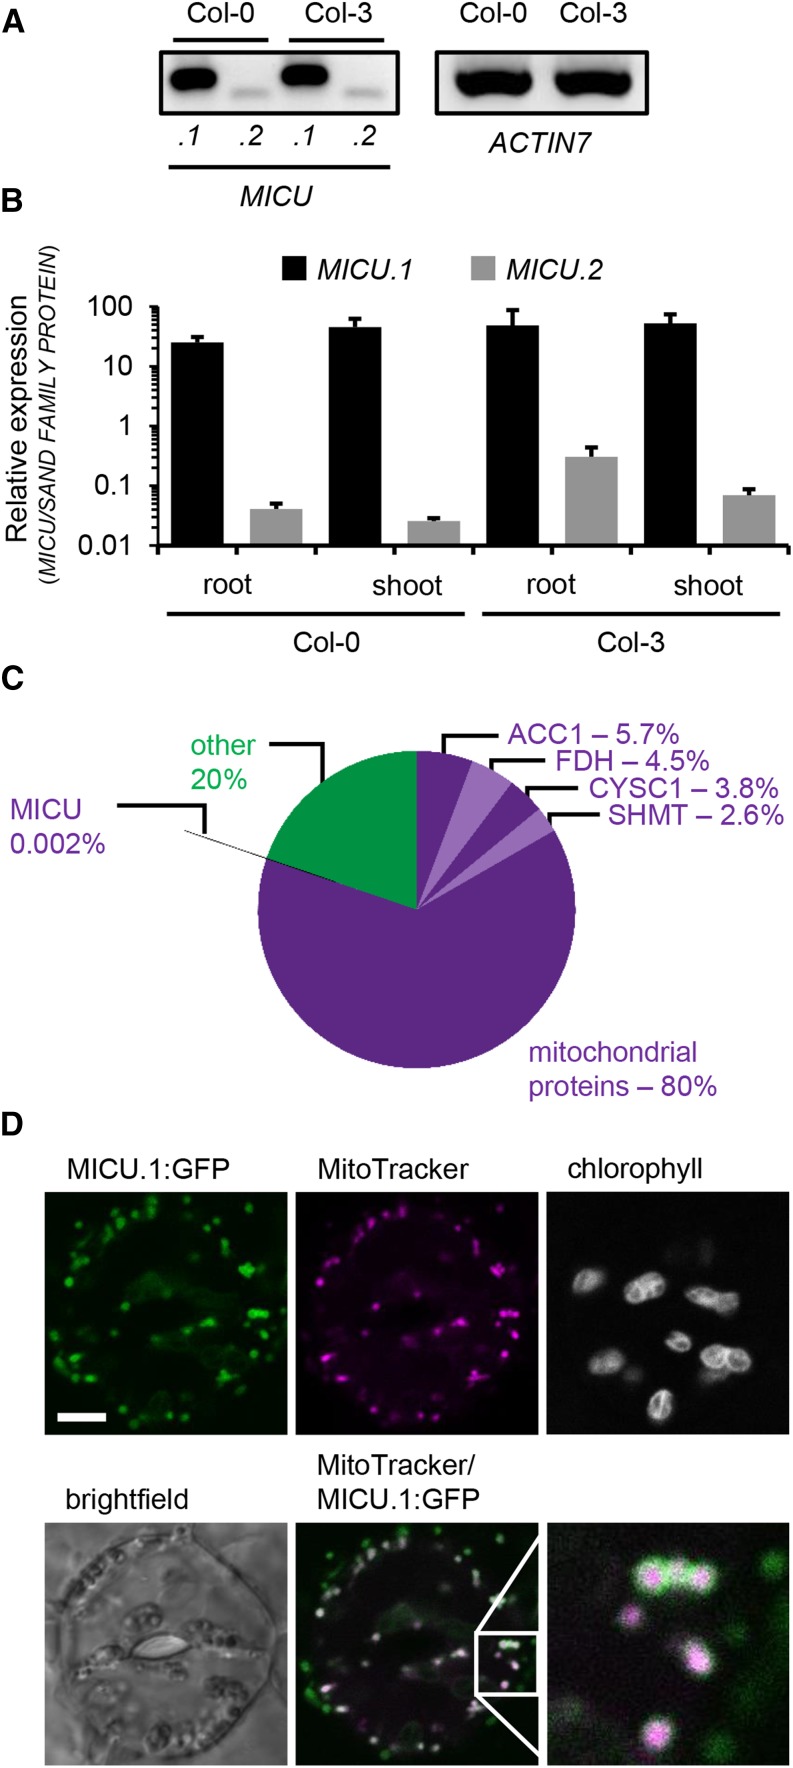
Expression and Subcellular Localization of MICU in Arabidopsis.
(A) Splicing variant-specific RT-PCR for MICU.1 and MICU.2 in extracts of whole Arabidopsis seedlings (Col-0 and Col-3). ACTIN7 was used as reference transcript.
(B) qRT-PCR of MICU.1 and MICU.2 in root and shoot tissue and SAND FAMILIY PROTEIN as a reference. Values are mean from three biological and three technical replicates; error bars = sd of biological replicates.
(C) Quantitative proteomic assessment of mitochondria isolated from Arabidopsis seedlings. iBAQ-based protein abundances annotated as mitochondrial (purple colors) and non-mitochondrial (green; Supplemental Data Set 2) are shown. In addition, the four most abundant proteins detected (all annotated mitochondrial; different shades of purple) and MICU are indicated with their respective abundances. ACC1, ATP/ADP carrier 1; FDH, formate dehydrogenase; CYSC1, cysteine synthase C1; SHMT, serine hydroxymethyl transferase 1.
(D) Representative image of an Arabidopsis seedling stably expressing MICU.1:GFP. Leaf was stained with MitoTracker Orange, and the epidermis was imaged by confocal laser scanning microscopy. The lower right image represents a magnified view of the region in the square. GFP, green; MitoTracker, magenta. Bar = 5 μm.

