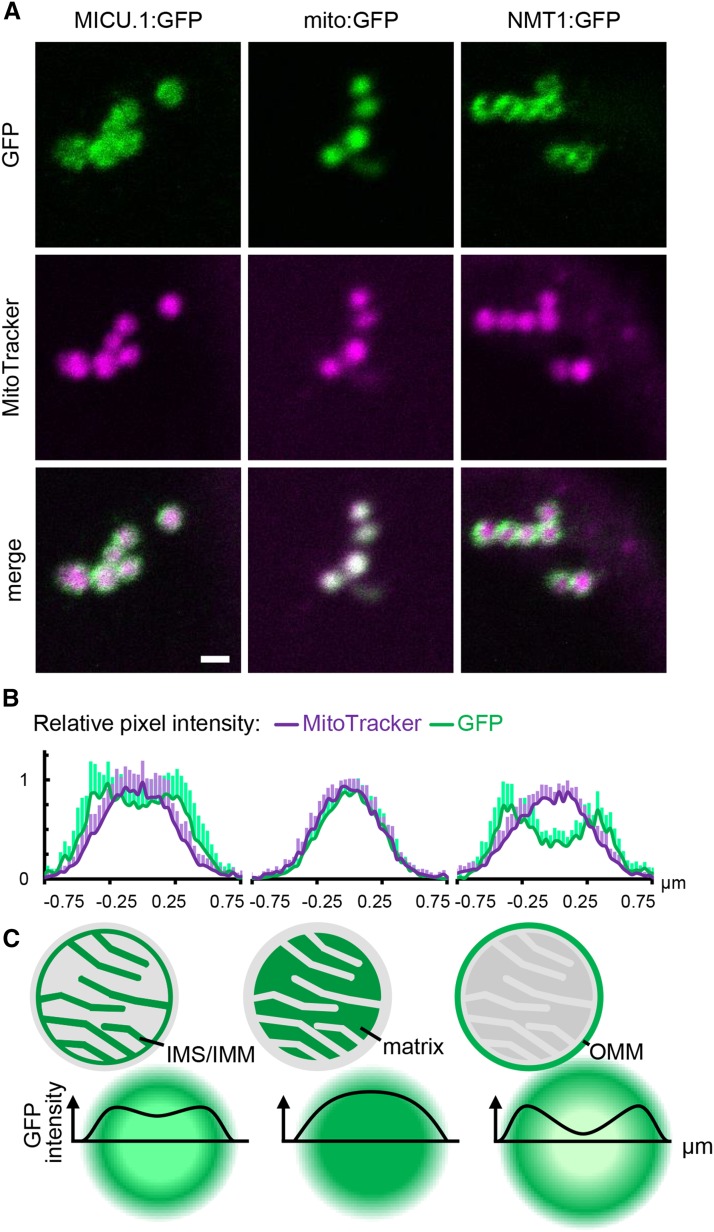
Figure 3.
Fine Localization of MICU in Arabidopsis Mitochondria.
(A) Confocal laser scanning microscopy images of Arabidopsis seedlings expressing MICU.1:GFP and stained with MitoTracker Orange. GFP fusions of the Nicotiana plumbaginifolia β-ATPase mitochondrial presequence (mito:GFP) and NETWORK1/ELM1 (NMT1) were used as markers for the mitochondrial matrix and outer mitochondrial membrane (OMM), respectively. GFP, green; MitoTracker, magenta. Bar = 1 μm.
(B) Pixel intensities in the GFP and MitoTracker channels plotted across individual mitochondria. n = 9; error bars = sd.
(C) Schematic representation of intensity distributions as predicted for different mitochondrial subcompartments due to the limit of resolution for conventional light microscopy (Abbe limit).

