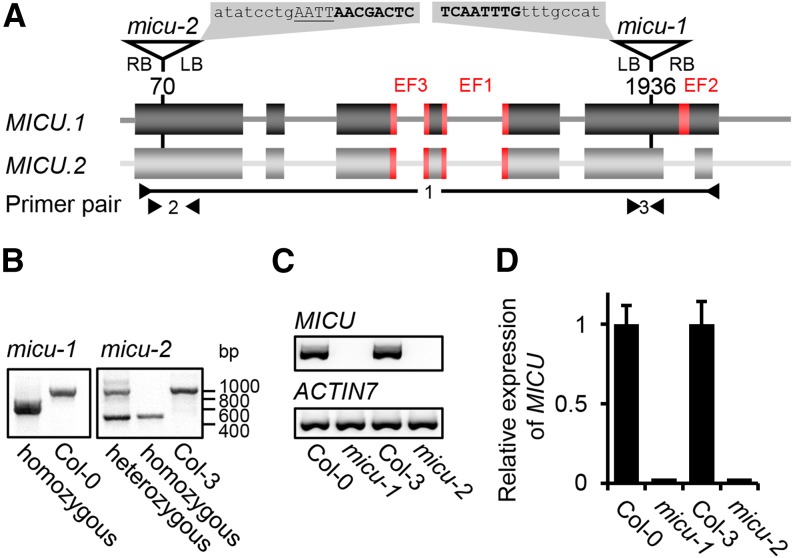
Figure 4.
Molecular Characterization of T-DNA Insertions in the MICU Locus.
(A) Triangles and corresponding nucleotide positions indicate T-DNA insertions in the MICU gene model for the micu-1 and micu-2 lines. Sequences on gray background show the precise insertion sites determined by sequencing. T-DNA in lowercase, endogenous sequence in bold capitals, and additional base pairs in underlined capitals.
(B) Genotyping of the T-DNA insertions in both micu lines.
(C) and (D) MICU transcript analysis in both micu lines by standard PCR using primer pair 1 (P2886/P2893) and ACTIN7 (P364/P436) as reference gene (C) and by quantitative RT-PCR with primer pairs 2 (P3529/P3530) and 3 (P3389/P3390) and SAND FAMILIY PROTEIN (P2455/P2456) as reference (D). Values are mean from three biological and three technical replicates; error bars = sd of biological replicates.

