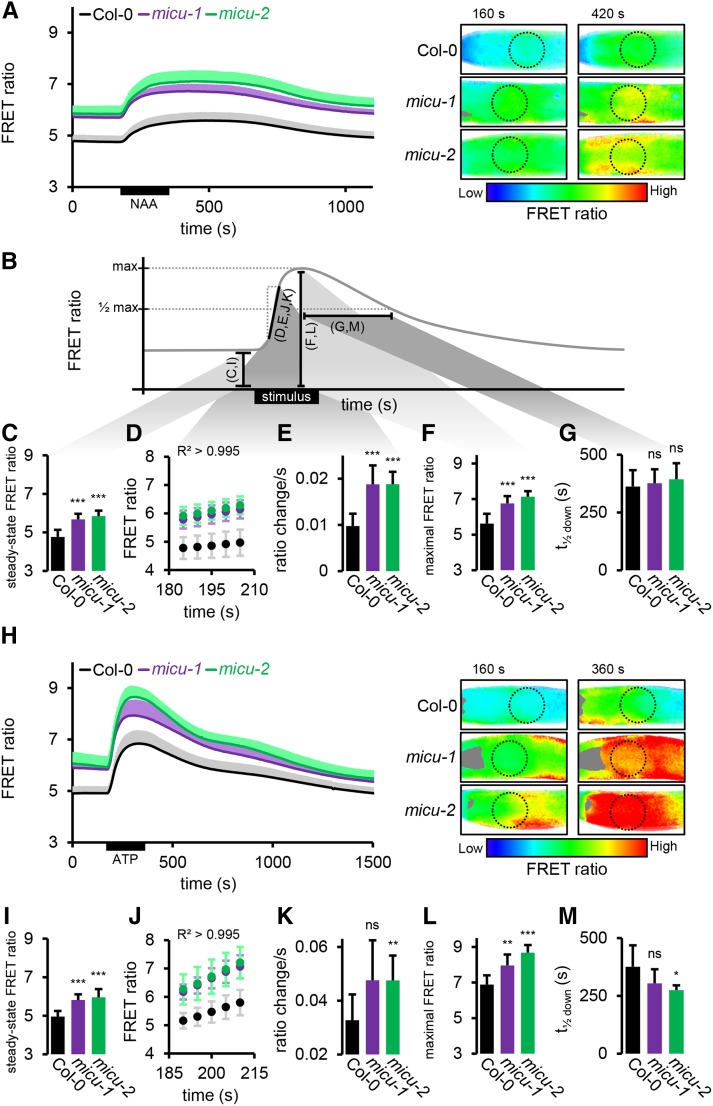
Figure 6.
Matrix Ca2+ Transients in Root Tips of micu and Wild-Type Seedlings.
(A) Root tips of seedlings expressing 4mt-YC3.6 in control (Col-0) imaged under continuous perfusion and treated with 10 μM NAA for 3 min. FRET ratios of the ROI optimized in Figure 5C (dotted circles) are plotted over time. Representative ratiometric images are shown for two selected time points with low FRET ratios, indicating low Ca2+, in blue and high FRET ratios, indicating high Ca2+, in red.
(B) Schematic representation of the extracted kinetic parameters of the sensor response shown in the individual panels. Black bars and letters in parentheses indicate the individual parameters analyzed in (C) to (G) and (I) to (M). This relationship is further illustrated by gray shading between black bars and by (C) to (G).
(C) Steady state FRET ratios preceding NAA application (averaged over 35-s time window).
(D) FRET ratio increase following NAA application; linear region was selected with R2 > 0.995.
(E) Linear rate representing slope of regression of (D).
(F) Peak FRET ratio after NAA application.
(G) Time to pass half-maximal ratio during recovery.
(H) to (M) Analogous measurements as for (A) to (F) of treatments with 0.1 mM ATP instead of NAA. n ≥ 7; error bars = sd (for each data point of the time lapse curves indicated in gray, light purple, and light green). *P ≤ 0.05, **P ≤ 0.01, and ***P ≤ 0.001 (t test).

