Figure 8.
Root Mitochondrial Ultrastructure, Respiration, and Whole-Plant Development of micu Lines.
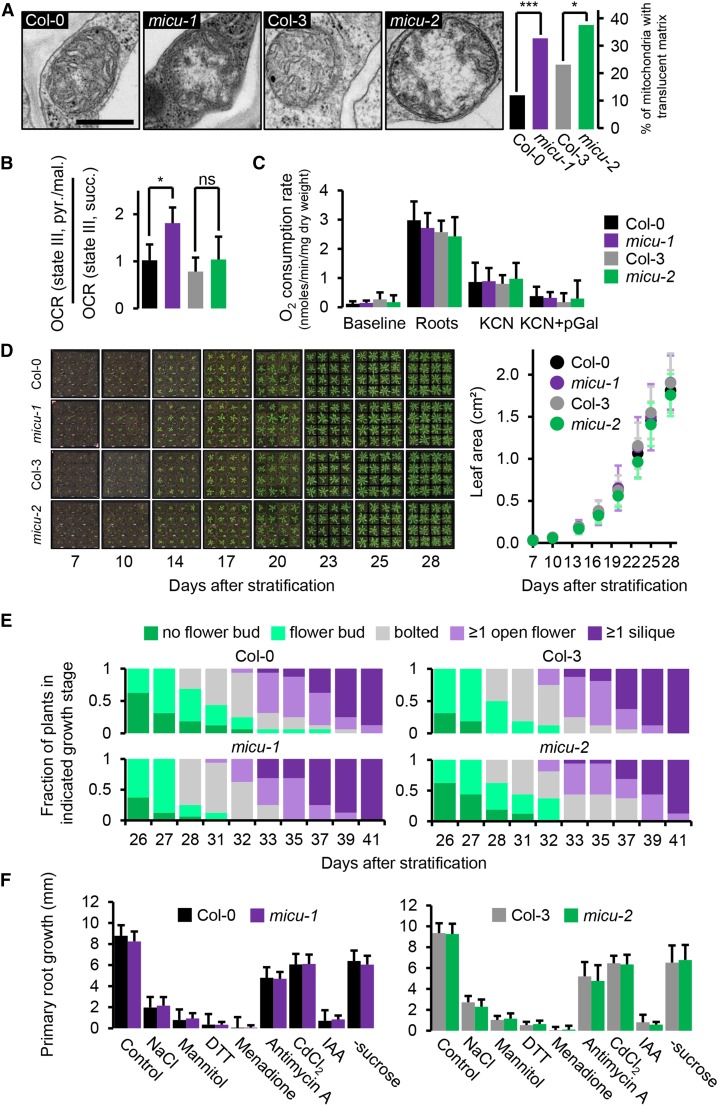
(A) Mitochondrial ultrastructure in cells of the root elongation zone of Arabidopsis seedlings. Exemplary electron micrographs of micu-1, micu-2, and their respective wild types (Col-0 and Col-3; see Supplemental Figure 8A for more images) to illustrate the overrepresentation of mitochondria with translucent matrices in the micu lines. Percentages of mitochondria scored by matrix appearance are shown as a bar graph; ≥185 mitochondria from three different seedlings were scored per line. Col-0 (black), micu-1 (purple), Col-3 (gray), and micu-2 (green). The analysis was repeated twice with consistent observations. *P ≤ 0.01 and ***P ≤ 0.001 (χ2 test; Supplemental Table 2). Bar = 0.5 μm.
(B) OCRs under pyruvate/malate-driven state III respirations over OCR under succinate-driven state III respiration of purified mitochondria of micu-1, micu-2, and their respective wild-type seedlings (Supplemental Figure 9). *P ≤ 0.05 and (ns) P > 0.05 (t test).
(C) Root respiration rates of micu-1, micu-2, and their respective wild-type lines and after addition of KCN (4 mM) and KCN (4 mM) + pGal (propylgallate; 0.2 mM). n = 5; error bars = sd.
(D) Vegetative rosette growth of micu-1, micu-2, and their respective wild types (Col-0 and Col-3) between 7 and 28 d after stratification as measured by total leaf area. n = 16; error bars = sd.
(E) Distribution of reproductive growth stages over time. n = 16.
(F) Root growth under abiotic stress treatments. Seedlings were grown on vertical 0.5× MS + 1% (w/v) sucrose medium plates for 5 d before being carefully transferred onto media supplemented with stress-inducing additives or lacking sucrose: NaCl (150 mM), mannitol (300 mM), DTT (1 mM), menadione (60 μM), antimycin A (20 μM), CdCl2 (100 μM), and IAA (indole-3-acetic acid; 1 μM). Primary root growth 2 d after seedling transfer is shown. n ≥ 24 per genotype and condition; error bars = sd.
None of the pairwise comparisons for (C), (D), and (F) (micu versus the wild type; t test) indicated any significant (P < 0.05) change. All phenotyping experiments were repeated at least twice with similar results.

