Figure 1.
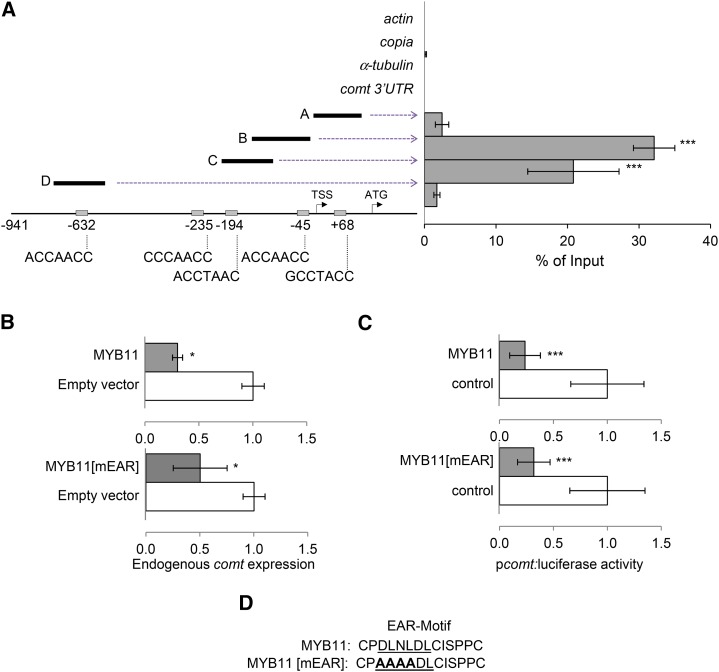
Maize MYB11 Binds to the comt Promoter to Repress Its Expression.
(A) ChIP-qPCR analyses of MYB11 binding to the comt promoter. Fragments A, B, C, and D represent the different comt promoter regions analyzed. The negative controls were actin, copia, α-tubulin, and comt 3′UTR. The position and sequence of the five AC-rich elements present in the comt promoter or 5′UTR are indicated on the bottom of the scheme. Results are represented as percentage of input, and the error bars indicate the se of the data obtained from three independent biological replicates. Statistical analysis of differences between fragments of comt promoter and actin, copia, α-tubulin, and comt 3′UTR was performed using Student’s t test (***P < 0.005).
(B) Effect of MYB11 and MYB11[mEAR] on comt mRNA accumulation. Maize protoplasts were transiently transformed with p35S:MYB11:C-GFP (top panel) or p35S:MYB11[mEAR]:C-GFP (bottom panel) and the empty vector (p35S:C-GFP) as control. comt gene expression was measured by qPCR using actin as internal control. Data are the mean of three independent transformations. Error bars indicate the se. Statistical analysis of differences between samples was performed using the Student’s t test (*P < 0.05).
(C) Effect of MYB11 and MYB11[mEAR] on comt promoter-driven luciferase expression. Maize protoplasts were transiently cotransformed with p35S:MYB11:C-GFP (top panel), p35S:MYB11[mEAR]:C-GFP (bottom panel), or 35S:C-GFP and Luciferase fused to the comt promoter (pcomt:luciferase). Transactivation assays were done in biological triplicates, and data were normalized for Renilla activity. Error bars indicate the se. Statistical analysis of differences between samples was performed using the Student’s t test (***P < 0.005).
(D) The mutated EAR motif of MYB11.

