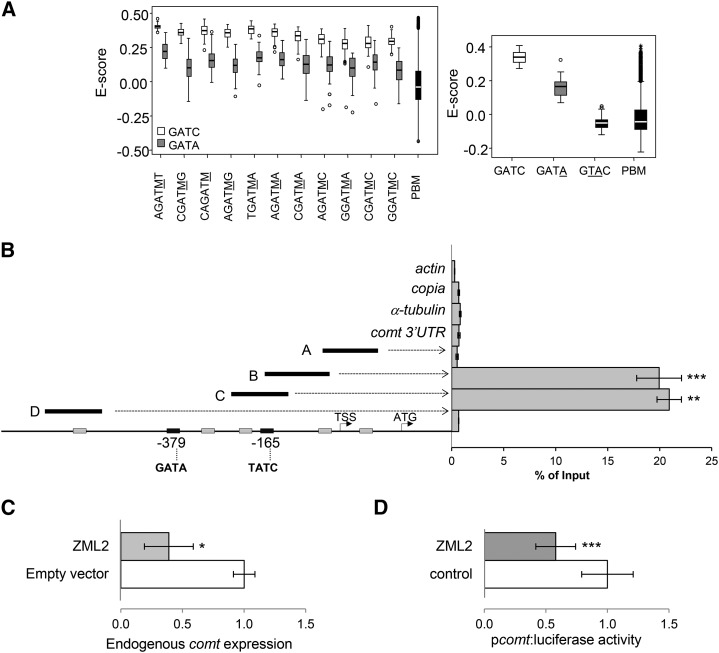
Figure 4.
ZML2 Binds the GATA cis-Elements of the Maize comt Promoter in Vivo.
(A) Determination of the DNA binding specificity of ZML2 in vitro using protein binding microarrays. Left: box plot of enrichment scores (E-scores) of all the possible 6-mers containing the 4-mer core GATA (gray) or GATC (white). Underlined M corresponds to C or A. Right: box plot of E-scores of all the possible 6-mers containing the 4-mer core indicated. Boxes represent quartiles 25 to 75%. Horizontal line represents the median of the distribution (quartile 50%). Bars indicate quartiles 1 to 25% (above) and 75 to 100% (below), and dots denote outliers of the distribution. PBM indicates the distribution of E-scores of all the possible 6-mers represented in the microarray.
(B) ChIP-qPCR analyses of ZML2 binding to the comt gene promoter. Fragments A, B, C, and D represent the comt promoter regions analyzed. actin, copia, α-tubulin, and comt 3′UTR were used as a controls. The position of the two GATA-rich elements is indicated at the bottom. Results are represented as percentage of input. Error bars indicate the se of the data obtained from three biological replicates. Statistical analysis of differences between fragments of comt promoter and internal negative controls was performed using Student’s t test (**P < 0.01 and ***P < 0.005).
(C) Effect of ZML2 on the expression of the endogenous comt gene. Maize protoplasts were transformed with p35S:ZML2:C-GFP and the empty vector (p35S:C-GFP) as control. comt expression was measured by qPCR using actin as control. Data are the means of three independent transformations. The error bars indicate the se. Statistical analysis of differences between samples was performed using the Student’s t test (*P < 0.05).
(D) Effect of ZML2 on the comt gene promoter-driven luciferase expression (pcomt:luciferase). Maize protoplasts were cotransformed with p35S:ZML2:C-GFP or 35S:C-GFP and pcomt:luciferase. Transactivation assays were done in biological triplicates, and data were normalized for Renilla activity. Error bars indicate the se. Statistical analysis of differences between samples was performed using the Student’s t test (*P < 0.05 and ***P < 0.005).

