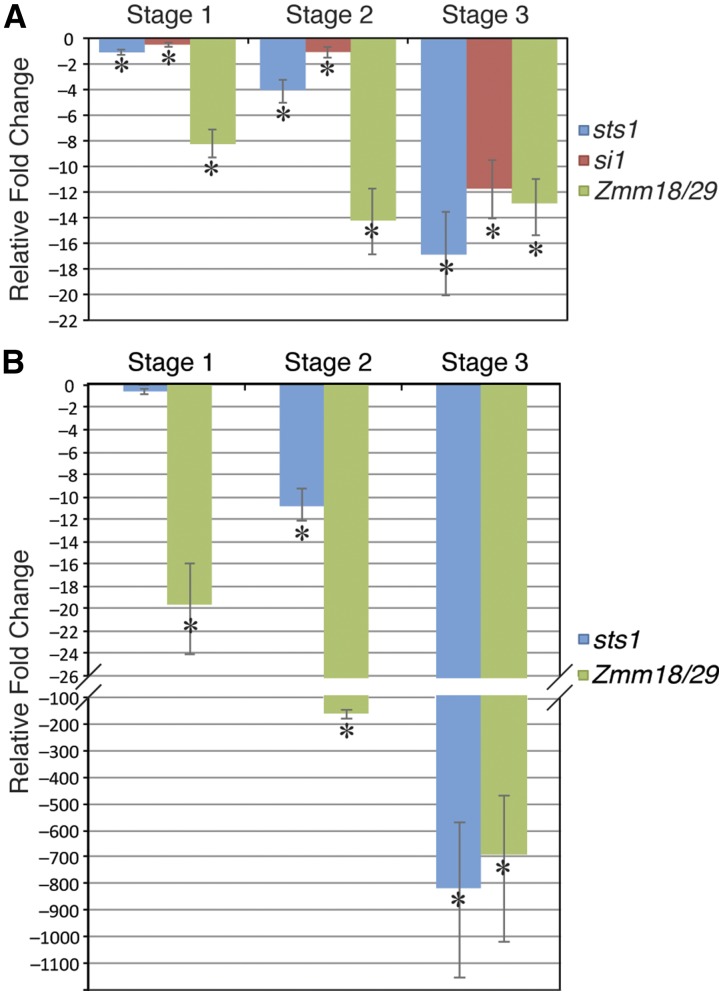
Figure 6.
Positive Autoregulation of Maize B Class Genes.
(A) RT-qPCR expression analysis of B class genes in successively older stages of sts1-1 tassel florets. Expression of all B class genes show significant downregulation at all stages, but the downregulation is more dramatic at later stages.
(B) RT-qPCR expression analysis of B class genes in si1-mum2 tassel florets.
In both (A) and (B), fold change is calculated relative to wild-type controls at the same stage. Error bars show sd from the mean, while asterisk indicates downregulation that is significant at P < 0.05 as determined by a t test.

