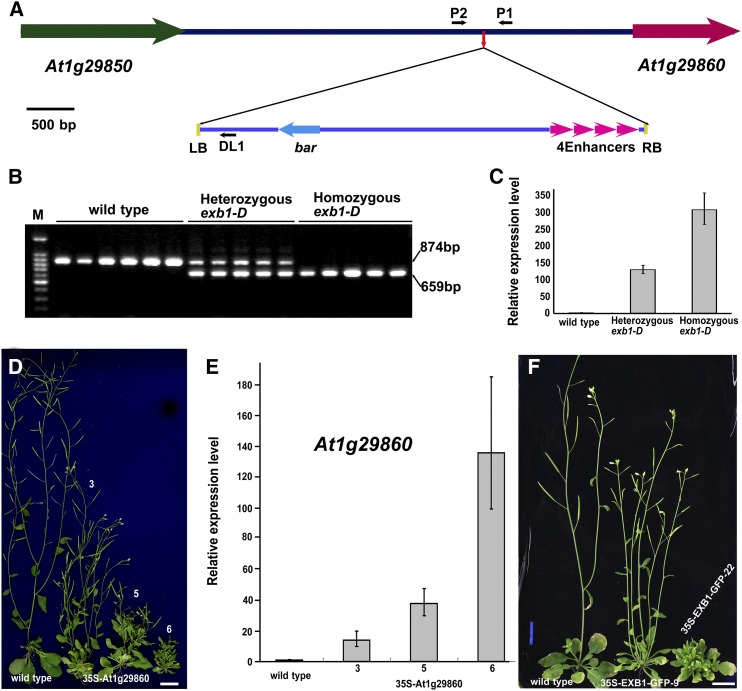
Figure 2.
The Phenotypes of exb1-D Are Caused by Overexpression of At1g29860.
(A) Schematic representation of the T-DNA insertion site in exb1-D. The colored arrows represent genes, and lines indicate the intergenic region. The small red arrow in the intergenic region indicates the T-DNA insertion site. The four magenta arrowheads represent the four CaMV 35S enhancers in pSKI015. The small black arrows represent DL1, P1, and P2 primers used in cosegregation analysis. LB, T-DNA left border; RB, T-DNA right border; 4Enhancers, four CaMV 35S enhancers; bar, Basta resistance gene.
(B) Cosegregation analysis of T-DNA insertion with the increased branches. The 874-bp DNA bands were amplified from the wild type and the 659-bp bands from exb1-D.
(C) The relative expression level of At1g29860 in the wild type, heterozygous exb1-D, and homozygous exb1-D. The expression level of EXB1 in the wild type was set to 1.0. The error bars represent the sd of three biological replicates.
(D) The exb1-D phenotypes were recapitulated by overexpressing At1g29860 using a CaMV 35S promoter. From left to right, 40-d-old wild type and three independent 35S-At1g29860 transgenic lines. Bars = 1 cm.
(E) The relative expression level of At1g29860 in the wild type and the three 35S-At1g29860 transgenic lines in (D). The expression level of At1g29860 in the wild type was set to 1.0. The error bars represent the sd of three biological replicates.
(F) The overexpression of EXB1 fused with GFP also recapitulated the phenotypes of exb1-D. From left to right, 40-d-old wild type and two independent 35S-EXB1-GFP transgenic lines. Bars = 1 cm.

