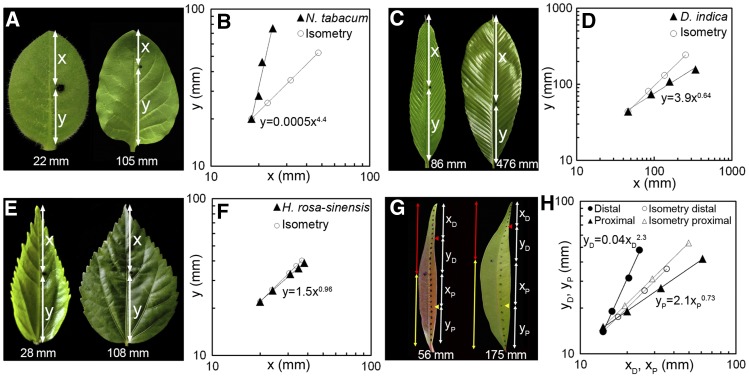
Figure 3.
Analysis of Leaf Growth Allometry.
Ink spots were introduced on the surface of young leaves (pictures on the left in [A], [C], [E], and [G]) of N. tabacum ([A] and [B]), D. indica ([C] and [D]), H. rosa-sinensis ([E] and [F]), and S. jambos ([G] and [H]) and tracked until maturity (pictures on the right) (also see Supplemental Figure 1). For N. tabacum, D. indica, and H. rosa-sinensis, lengths of the distal (x) and the proximal (y) halves were measured at regular intervals, and the (x, y) values were plotted on double logarithmic scale ([B], [D], and [F], respectively) and fitted to the equation y = bxα to determine the value of growth ratio (α). The actual values of x and y during growth are represented by triangles, while circles represent the theoretical values of x and y had the growth been isometric. For S. jambos, which showed bidirectional growth pattern ([G] and [H]), similar analysis of growth allometry was performed for the distal half (red line in [G]) and the proximal half (yellow line in [G]) separately. In the young S. jambos leaf (56 mm long), centers of the distal and the proximal halves are shown by the red and the yellow arrowheads, respectively. xD and yD represent the distal and the proximal parts of the distal half, respectively; xP and yP represent the same in the proximal half (G). The same points are marked in the mature (175 mm long) leaf. Plotting the values of xD and yD on the log scale shows that the distal part of the leaf grows with positive allometry (αDistal = 2.3), while the proximal half of the leaf grows with negative allometry (αProximal = 0.73) (H). Closed circles indicate the actual values of xD and yD and closed triangles those of xP and yP during growth; theoretical values of xD, yD, and xP, yP for isometric growth are represented by open circles and triangles, respectively.

