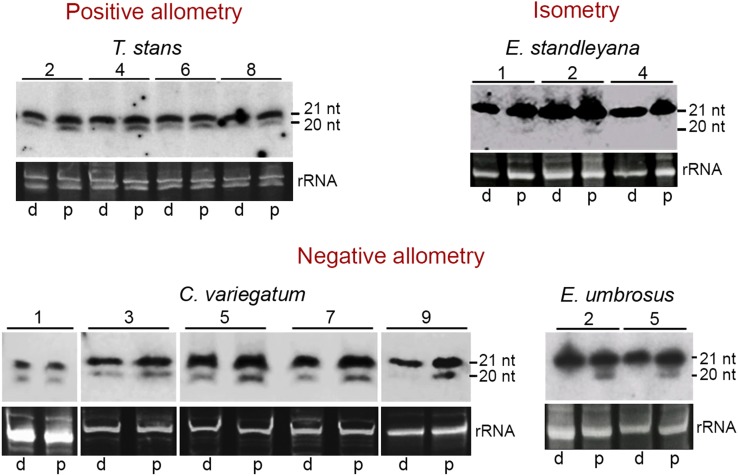
Figure 6.
Expression Pattern of miR319 in Developing Leaves.
Small RNA gel blots showing the expression pattern of miR319 in developing leaves with positive allometry, negative allometry, and isometry. The 20-nucleotide band represents miR319, while the 21-nucleotide band is thought to be contributed mostly by the closely related miR159. Leaf lengths (in cm) are indicated above the blots. Proximal and distal halves are represented by p and d, respectively. Ethidium bromide-stained gels are shown for loading control.

