Figure 7.
Expression Patterns of miR396 and Its Target GRF2 Genes in Developing Leaves.
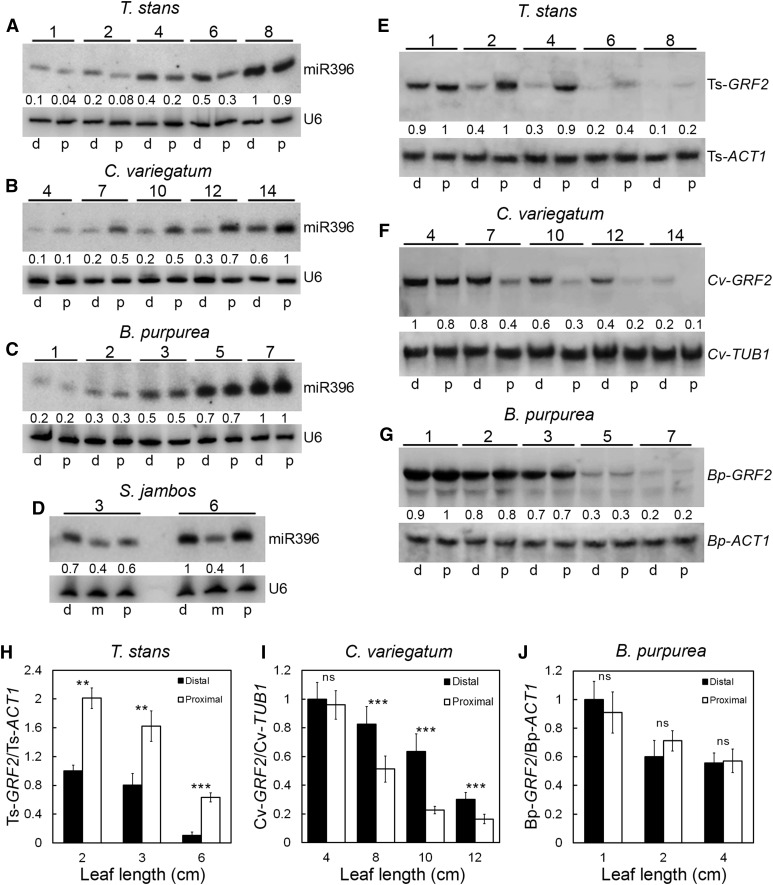
(A) to (D) Small RNA gel blots showing the expression pattern of miR396 in developing leaves with positive allometry (A), negative allometry (B), isometry (C), and complex allometry (D). U6 expression was used as internal control.
(E) to (G) RNA gel blots showing the distribution of miR396-targeted GRF2 genes in growing leaves with positive allometry (E), negative allometry (F), and isometry (G). The probes for the GRF2 genes and the internal controls are indicated. Leaf lengths (in cm) are indicated above the blots.
For (A) to (C) and (E) to (G), d and p refer to distal and proximal halves of the leaves, respectively. For (D), d, m, and p refer to distal, middle, and proximal thirds of the leaves, respectively. Quantification of the band intensities of miR396 and the target GRF2 relative to the respective loading controls is indicated below the blots.
(H) to (J) RT-qPCR analysis showing the relative distribution of GRFs in the distal and proximal halves of leaves at different growth stages (n = 3 to 6; average ± sd; *P ≤ 0.05; **P ≤ 0.005; ***P ≤ 0.0005; ns, P > 0.05).

