Figure 5.
Cell Cycle Analysis of Plate-Grown Wild-Type and Mutant Cells.
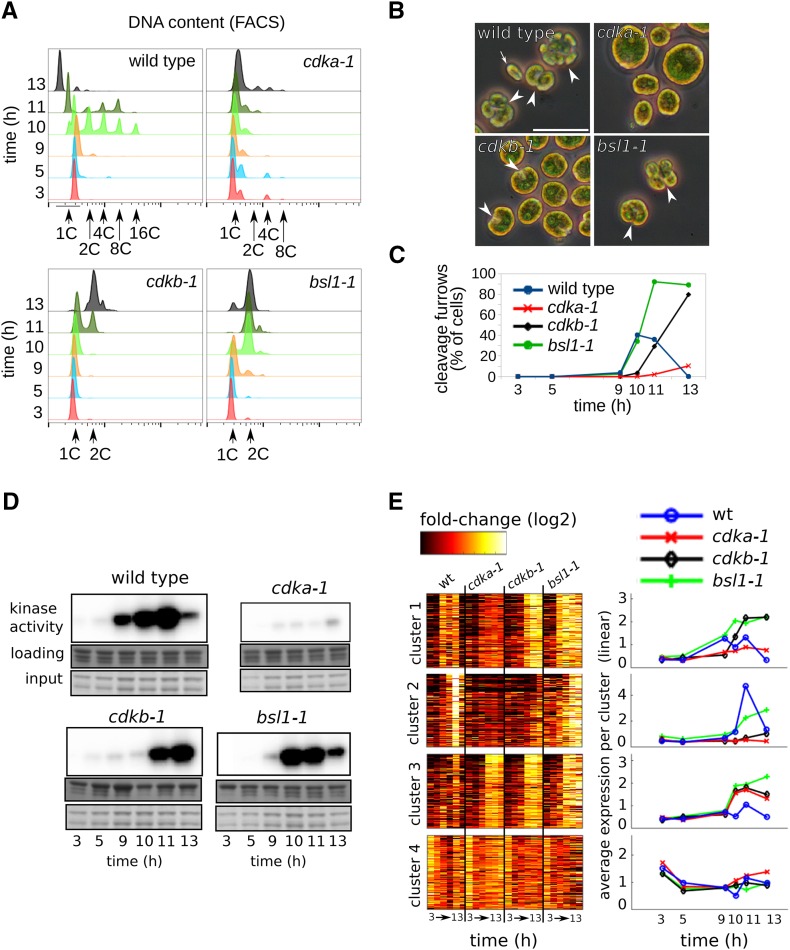
Wild-type, cdka-1, cdkb-1, and bsl1-1 mutant cells were grown in parallel on agar plates and shifted to restrictive temperature (33°C) at time zero.
(A) DNA content as determined by FACS. Wild-type cells go through S/M phase at 10 to 11 h, as determined by accumulation of cells with 2, 4, 8, and 16C DNA content. Newborn cells emerge at 13 h with 1C DNA. cdka-1 fails to replicate during the course of the experiment. cdkb-1 initiate DNA replication ∼1 h after the wild type and arrest with once-replicated 2C DNA. The bsl1-1 mutant initiates DNA replication with normal timing and arrests with 2C DNA.
(B) Representative micrographs of cells at the 11-h time point. White arrowheads, cleavage furrow; white arrow, newborn wild-type cell. Bar = 25 μm.
(C) Quantification of cleavage furrow development.
(D) Cks1-associated kinase activity. The sample for cdka-1 at 3 h was lost.
(E) Transcript abundance (relative to mean for each gene) is shown on a log2 scale for clusters 1 through 4 (left panel). Average transcript abundance for each cluster and genotype is shown on a linear scale (right panel).

