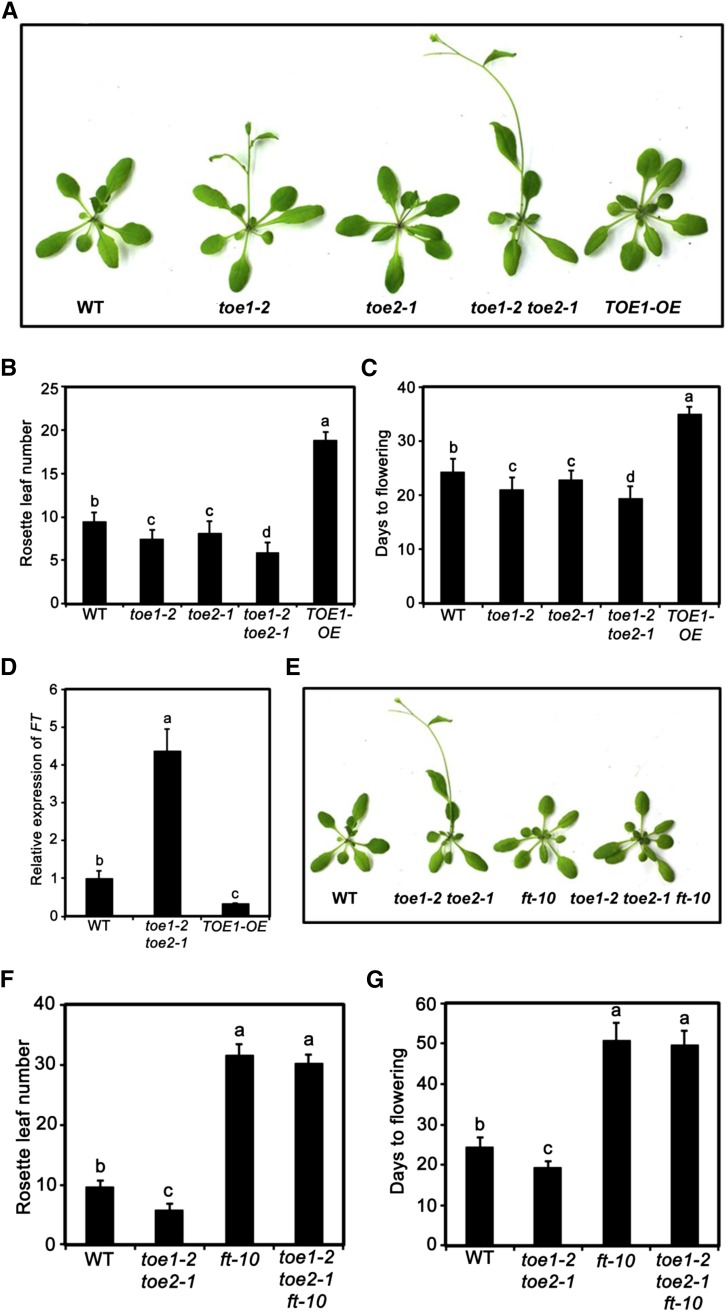
Figure 5.
TOE1 and TOE2 Delay Flowering through Negatively Regulating the Expression of FT.
(A) Representative image of the indicated genotypes showing their flowering phenotype under LD conditions.
(B) and (C) Flowering phenotype of the indicated genotypes assessed by RLN (B) and DTF (C) under LD conditions. Values are means ± sd of 20 to 30 plants. The experiment was repeated three times with similar results. ANOVA was performed for statistical analysis; bars with different letters are significantly different from each other (P < 0.01).
(D) Expression of FT in the indicated genotypes. Ten-day-old plants grown under normal growth conditions (23°C, LD) were harvested at ZT8 for total RNA extraction and qRT-PCR assays. Values are means ± sd of three technical replicates. ANOVA was performed for statistical analysis; bars with different letters are significantly different from each other (P < 0.01).
(E) to (G) the ft-10 mutation suppresses the early flowering phenotype of the toe1-2 toe2-1 double mutant. Flowering phenotype of the indicated genotypes under LD conditions are shown by representative image (E) or assessed by RLN (F) and DTF (G). Values are means ± sd of 20 to 30 plants. The experiment was repeated three times with similar results. ANOVA was performed for statistical analysis; bars with different letters are significantly different from each other (P < 0.01).

