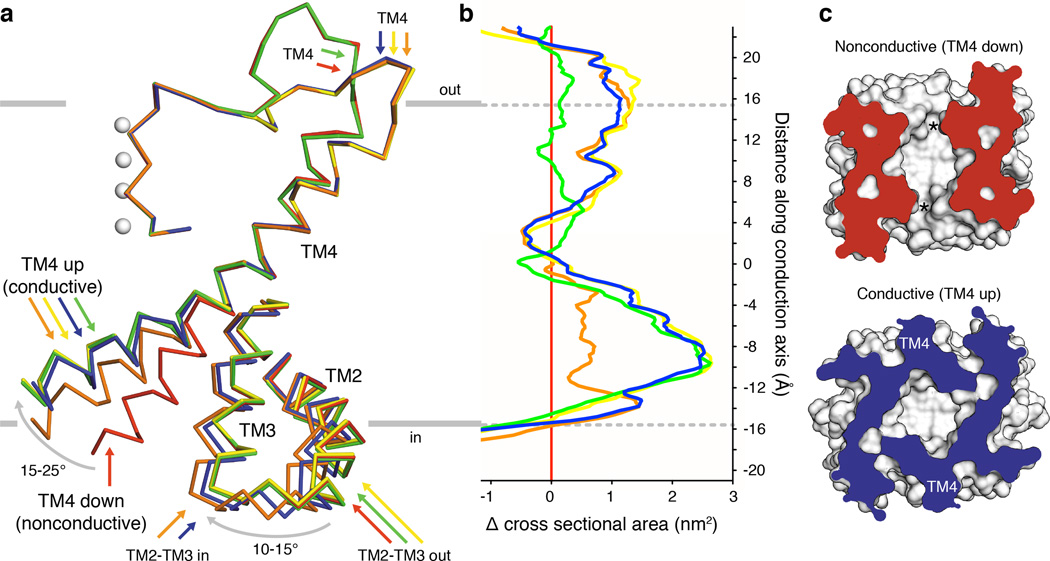
Figure 3. Conformational changes in conductive TRAAK structures expand the channel cross sectional area.
(a) Membrane view of an overlay of mobile elements in nonconductive (red) and conductive conformations (orange, green, yellow and blue) of TRAAK. (b) Difference in cross sectional area versus membrane depth calculated between each conductive conformation and the nonconductive conformation (positive values indicate area expansion upon channel opening, colors as in (a)). Depth is on the same scale as (a) with gray indicating bilayer boundaries. (c) Cytoplasmic view of nonconductive and conductive conformations clipped at –9 Å depth. Intramembrane openings (asterisks) or TM4 positions are indicated.

