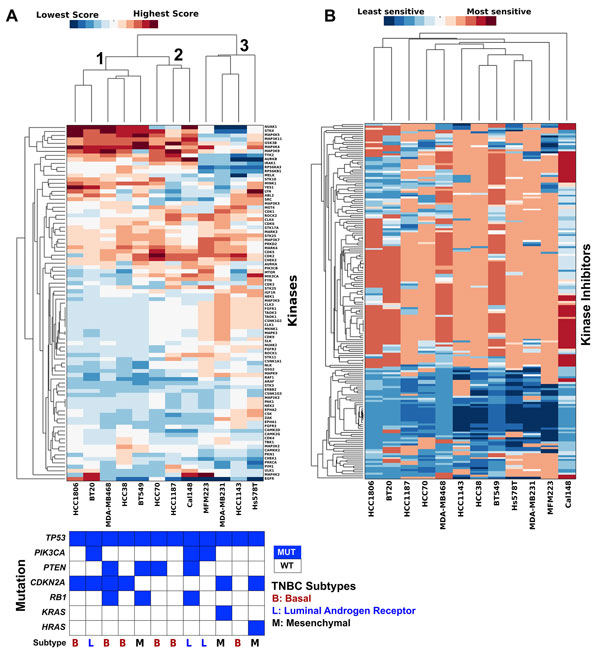
Figure 2.

KAR identifies relationships in kinase dependency in TNBC. A. Hierarchical clustering ofTNBC cell lines and kinases based on scaled kinase dependency scores. Each column was normalized to give a mean of 0 and a standard definition of 1. Red indicates that a cell line has a high dependence on a given kinase and blue indicates low dependence. Mutation and subtype information are also provided [1]. B. Hierarchical clustering of TNBC cell lines based on kinase inhibitor sensitivity data (from [23]). Clustering based on kinase inhibitor sensitivity resulted in different groupings compared to kinase dependency score. Red indicates that a cell line has higher sensitivity to a particular kinase inhibitor (lower IC50) and blue indicates lower sensitivity (higher IC50).
