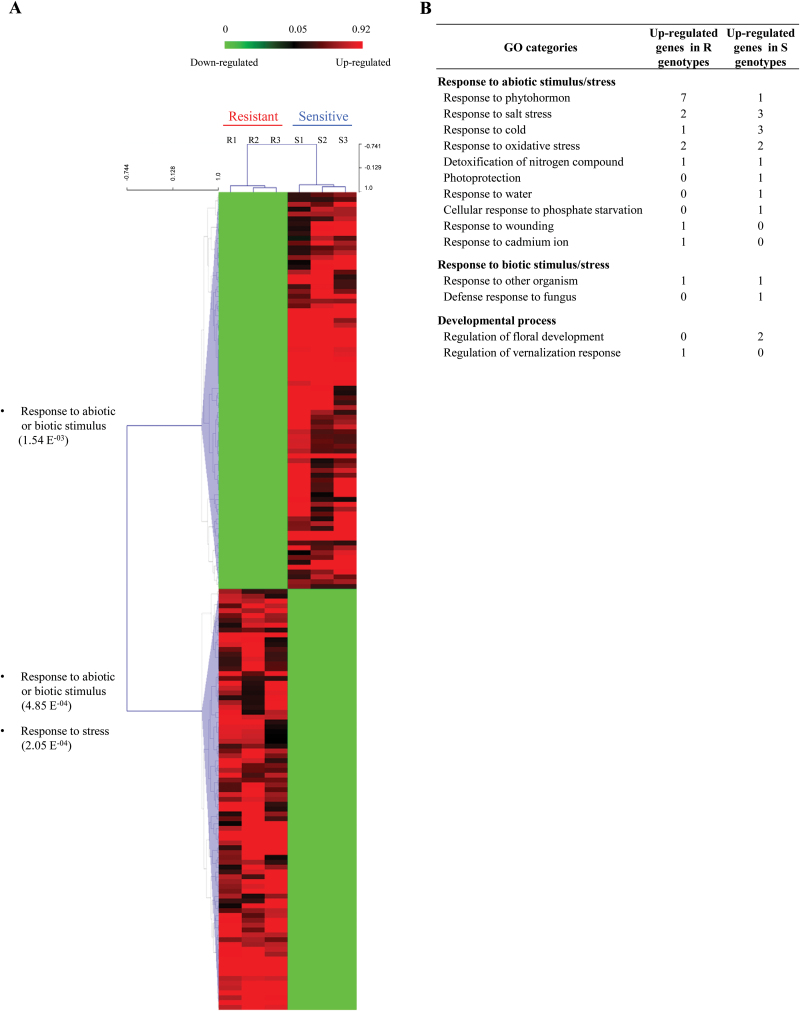
Fig. 2.
Transcriptomic characterization of the shoot apical meristem in sugar beet genotypes after vernalization. (A) Heatmap representation of the 169 differentially expressed genes (fold change R versus S >2 and t-test P-value <0.05) between bolting-resistant (R1–R3) and bolting-sensitive (S1–S3) genotypes after 9 weeks of vernalization treatment. On the left are indicated the main biological processes in which sequences could be involved and the corresponding P-value. (B) GO categories for genes involved in response to abiotic or biotic stimulus/stress and developmental process. (This figure is available in colour at JXB online.)

