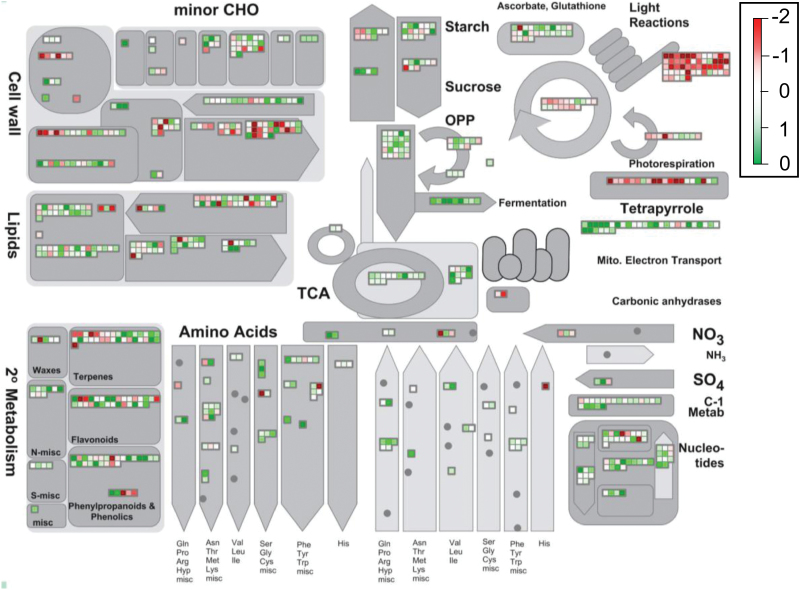
Fig. 1.
Mapman metabolic overview of the UCP1-overexpressor transcriptome. The 9822 transcripts declared as expressed (RPKM ≥0.1) were mapped into A. thaliana major metabolic pathways. Processes related to carbon fixation pathways appear to be repressed in UCP1 overexpressors. In contrast, transcripts related to energy expenditure processes seem to be induced in transgenic plants. The log2 ratio of the transgenic to the WT for individual genes was plotted onto boxes. Green boxes indicate upregulated genes and red boxes indicate downregulated genes.

