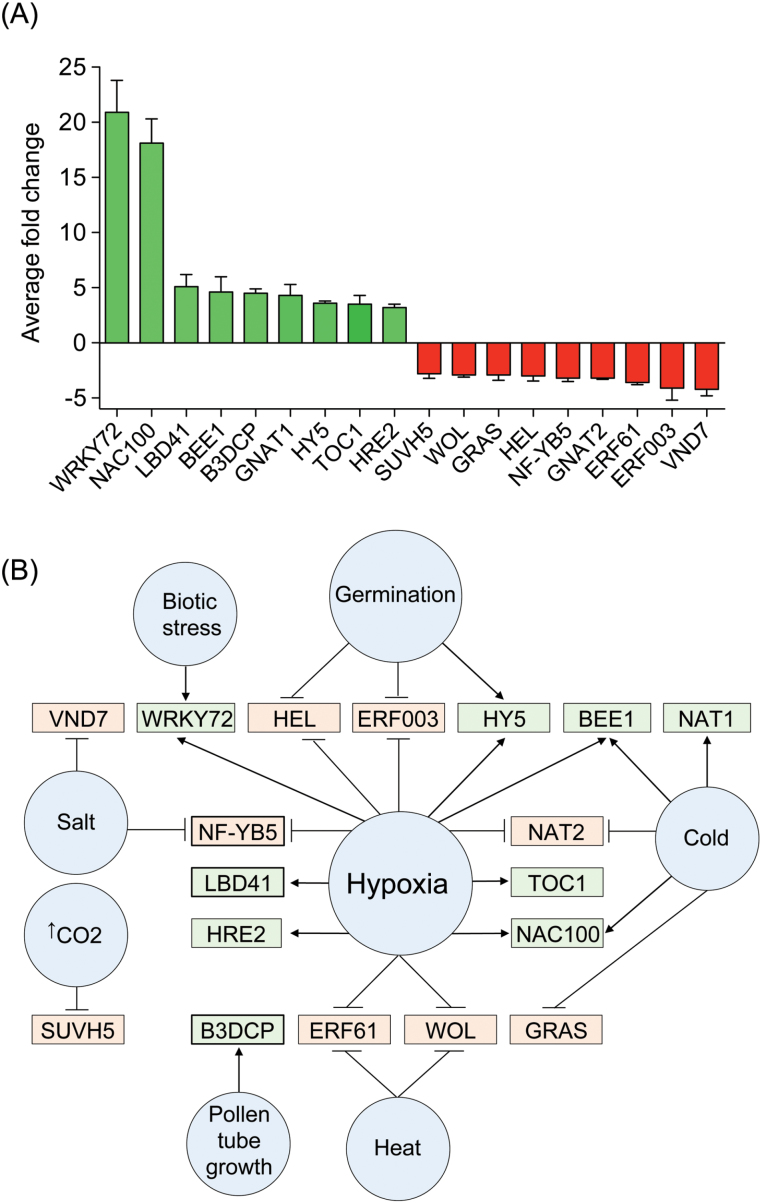
Fig. 4.
Characterization of differentially expressed TFs in AtUCP1 transgenic plants. The 18 most differentially expressed TFs were select for further evaluation using Genevestigator. (A) The most upregulated (green) or downregulated (red) TFs were selected. TFs that were downregulated in AtUCP1-overexpressing plants are shown in red boxes, and those that were upregulated are shown in green boxes. Bars represent means±SEM. The representative perturbations significantly affected each transcription factor gene expression by at least 2-fold (P<0.01). (B) The selected TFs were categorized accordingly to perturbations (blue circles) that impacted on their expression according to Genevestigator.

