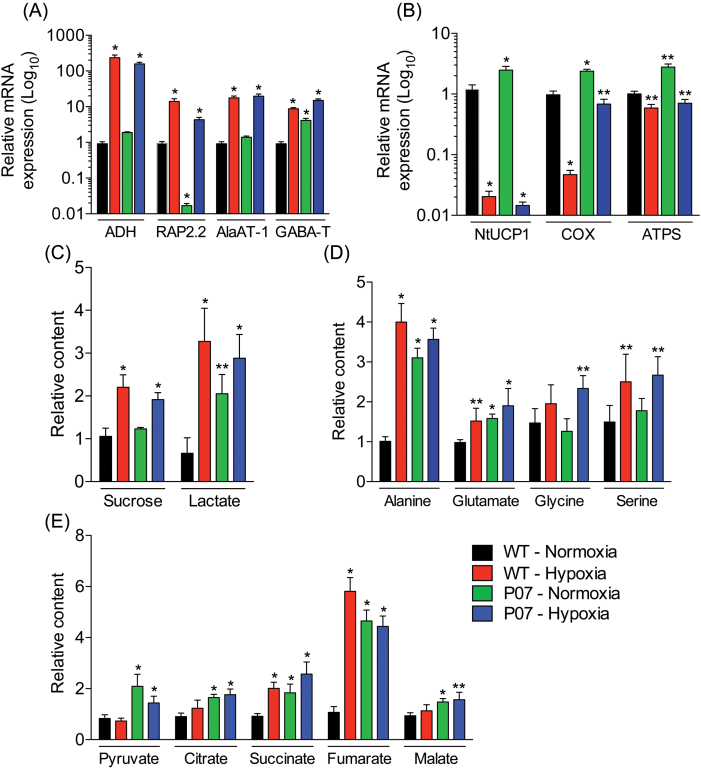
Fig. 5.
Metabolite and transcript profiles of AtUCP1-overexpressing and WT plants grown for 8h under hypoxia compared with plants grown in normoxia. (A, B) Transcript expression profiles of markers of hypoxic adaptation (A) and mitochondrial energy metabolism (B). (C, D) Metabolite profiles for carbohydrates and cytosolic metabolites (C), amino acids (D), and TCA intermediates (E). Bars represent means±SEM. **P<0.05; *P<0.1 (significantly different from the WT under normoxia).

