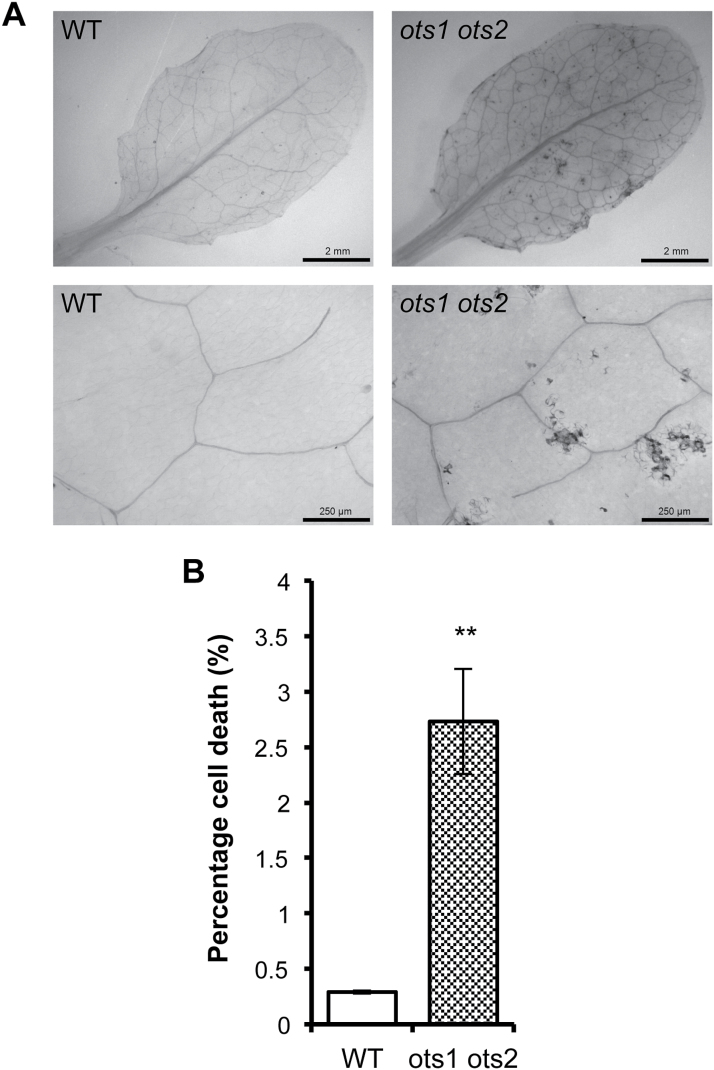
Fig. 2.
The ots1 ots2 double mutant displays spontaneous lesions. Trypan blue staining for cell death within comparable leaves from 2-week-old WT and ots1 ots2 double mutant plants. (A) Representative images of stained leaves. (B) Analysis of the percentage of cell death per 4mm2 across biological replicates using ImageJ. Error bars represent SEM. P values for differences between WT and mutants: **P=0.001–0.01 (unpaired Student’s t-test).

