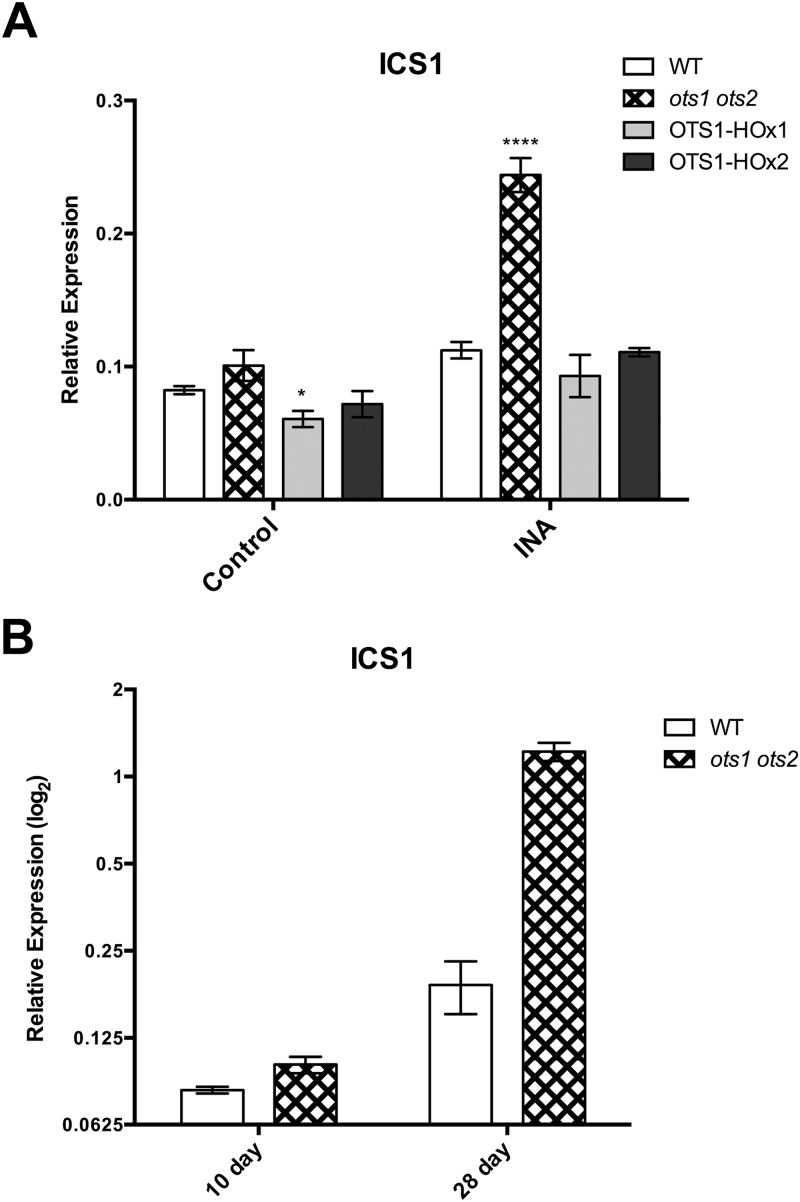
Fig. 5.
OTS1 and -2 restrict ICS1 gene expression. qPCR gene expression analysis of ICS1 in (A) 10-d-old WT, ots1 ots2 double mutant and transgenic OTS1-overexpressing (OTS1-HOx1 and -2) plants grown in the presence of INA (40mg ml–1) or solvent (control) (A) and in 10- and 28-d-old WT and the ots1 ots2 double mutant (B). Error bars represent SEM. P values for differences between WT and mutants: *P=0.01–0.05, ****P<0.0001, respectively (multi-way ANOVA with Tukey test post hoc).

