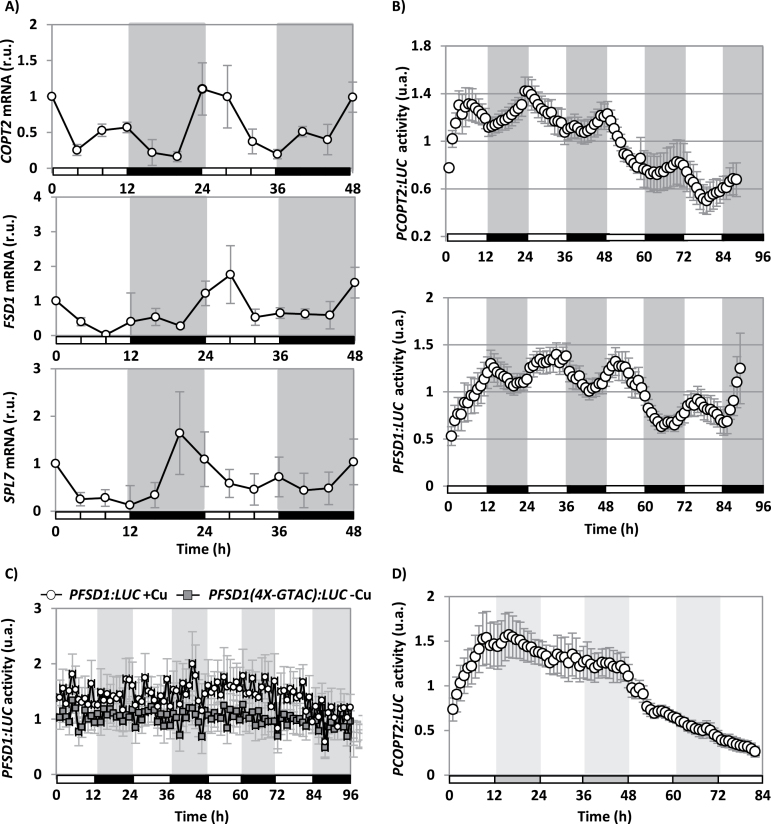
Fig. 2.
Diurnal COPT2, FSD1, and SPL7 gene expression in Cu deficiency. (A) WT seedlings were grown for 6 d under Cu deficiency (1/2 MS) in LDHC conditions. Samples were collected every 4 h during 2 d. The COPT2, FSD1, and SPL7 relative expression was analysed by qPCR. The UBQ10 gene was used as reference. The values are the mean of two replicates. mRNA levels are expressed as relative units (r.u.). (B) Bioluminescence of the PCOPT2:LUC and PFSD1:LUC seedlings grown under severe Cu deficiency (1/2 MS with 50 µM BCS), entrained for 7 d. Bioluminescence was measured under LDHC conditions every hour. The values are the mean ±SEM of 6–11 replicates. The grey and white bars indicate night and day, respectively. (C) Bioluminescence of the PFSD1:LUC and PFSD1(4X-GTAC):LUC seedlings grown under Cu deficiency (1/2 MS; grey squares) or Cu excess (1/2 MS with 10 µM CuSO4; white circles) entrained for 7 d. Bioluminescence was measured every hour. The values are the mean ±SEM of 6–12 replicates. The grey and white bars indicate the day and night, respectively. (D) Bioluminescence of the PCOPT2:LUC seedlings grown under Cu deficiency (1/2 MS) entrained for 7 d in LDHC and transferred to DDHH conditions. Bioluminescence was measured every hour after transfer to DDHH conditions. The values were the mean ±SEM of six replicates. The grey and white bars indicate the subjective day and night, respectively. The values are normalized to the mean of each trace over the time course and are expressed as arbitrary units (a.u.).

