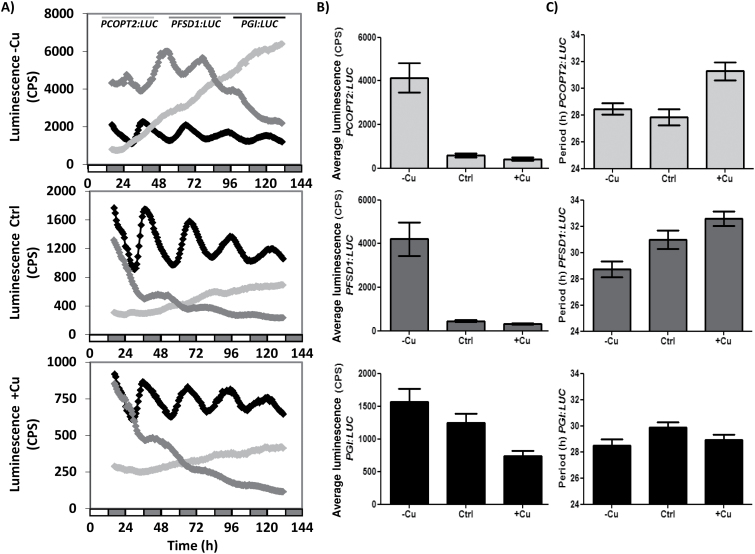
Fig. 3.
Luciferase activity driven by the COPT2 and FSD1 promoters. (A) Bioluminescence of the PCOPT2:LUC (grey line), PFSD1:LUC (dark grey line), and PGI:LUC (black line) seedlings grown under Cu deficiency (1/2 MS; –Cu), Cu sufficiency (1/2 MS with 1 µM CuSO4; Ctrl), or Cu excess (1/2 MS with 10 µM CuSO4; +Cu) entrained for 7 d in 12h light/12h dark at 20 °C and transferred to constant light conditions. Bioluminescence was then measured every hour. The values are the mean ±SEM of replicates (n=12). The grey and white bars indicate the subjective night and day, respectively. (B) Average luminescence of the PCOPT2:LUC (grey), PFSD1:LUC (dark grey), and PGI:LUC (black) seedlings grown on the same conditions as in (A). (C) Period of the PCOPT2:LUC (grey), PFSD1:LUC (dark grey), and PGI:LUC (black) seedlings grown on the same conditions as in (A).

