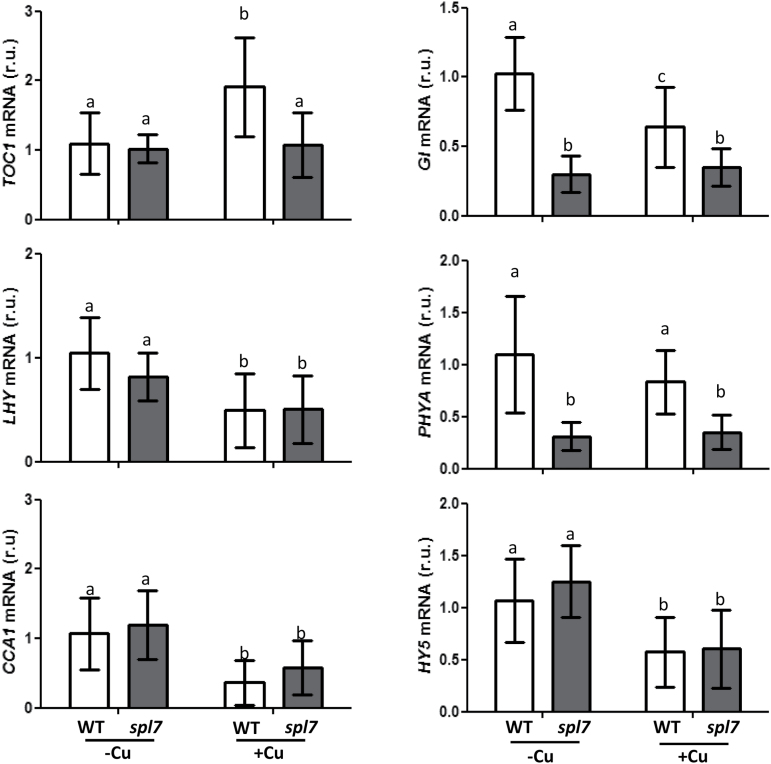
Fig. 6.
Regulation of TOC1, LHY, CCA1, GI, PHYA, and HY5 gene expression in the WT and spl7 mutant. The relative expression of the genes was determined by qPCR in 7-day-old WT (white bars) and spl7 (dark grey bars) seedlings grown under Cu deficiency (1/2 MS; –Cu) or Cu excess (1/2 MS with 10 µM CuSO4; +Cu). The UBQ10 gene was used as reference. mRNA levels are expressed as relative units (r.u.). The bars represent the mean ±SD of three replicates. Means with a different letter are significantly different (P<0.05).

