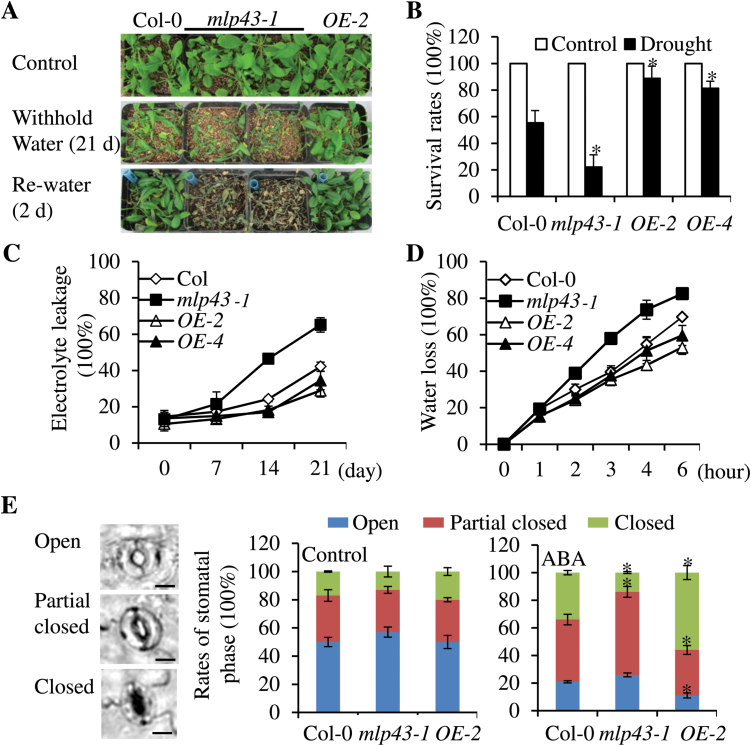
Fig. 3.
MLP43 involvement in drought stress responses. (A) Two-week-old plants were well watered (control) or deprived of water for 21 d and then rewatered. The photos were taken two days after rewatering. (B) Survival rates after the drought treatment in panel A. Data represent the means ±SEs of three replicated experiments (n>20 for each genotype, P<0.05). (C) Electrolyte leakage comparison at the indicated time points after drought treatment applied. Data represent the means ±SEs of three replicated experiments (n=15 for each genotype). (D) Transpirational water loss from well-watered detached leaves of four-week-old plants. Water loss rates are indicated as the percentage of the initial fresh weight (% FW). Results are shown as the means ±SEs of three replicated experiments (n=15 for each genotype). (E) Stomatal aperture under ABA treatment. The stomata phases are defined as shown in left panel. Scale bar, 5 μm. The rates of different stomata phases are calculated with or without ABA (30 μM) treatment for 30min. The data represent the means of four replicated experiments (n>50, P<0.05). (This figure is available in colour at JXB online.)

