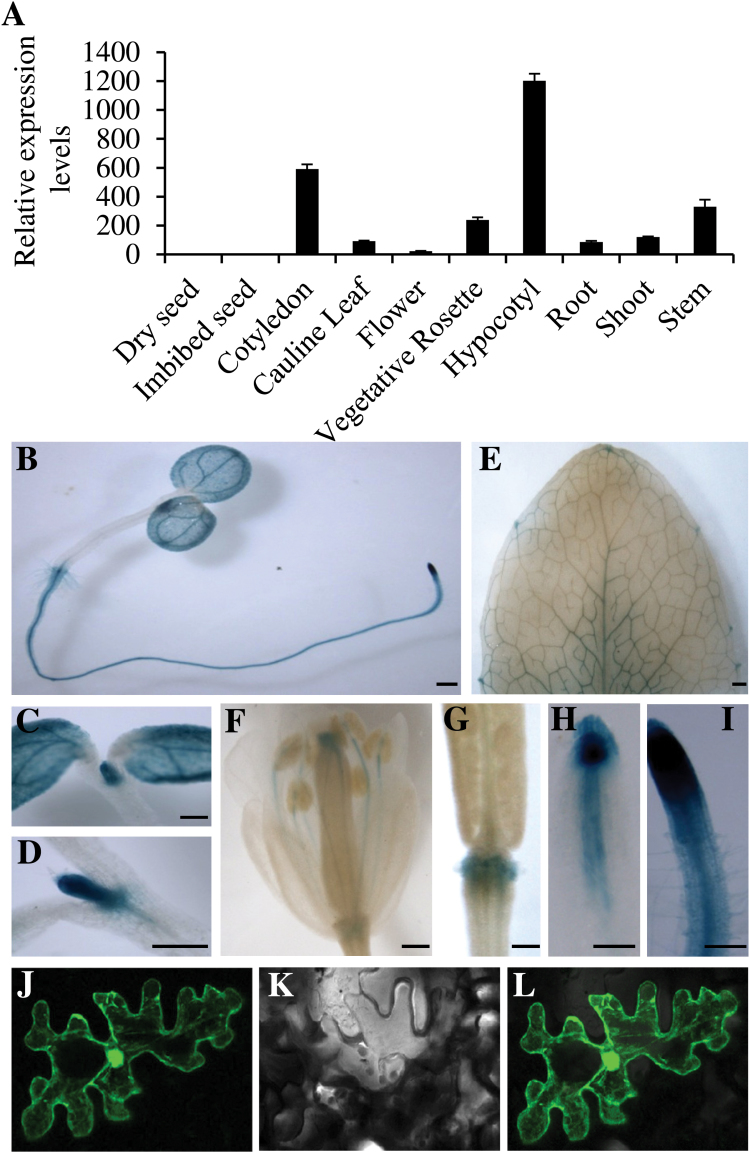
Fig. 4.
Tissue-specific expression patterns of MLP43. (A) Publicly available microarray data illustrating the tissue specific expression levels of MLP43 (http://bar.utoronto.ca/efp/cgi-bin/efpWeb.cgi). (B)–(I) Analysis of tissue-specific expression patterns by GUS histochemical staining. Scale bar, 0.5mm. (J)–(L) Subcellular localization of MLP43-GFP fusion protein drived by the 35S promoter. Bar, 10 μM. Photos taken under cofocal microscope J, GFP; K, bright field; L, overlay. (This figure is available in colour at JXB online.)

