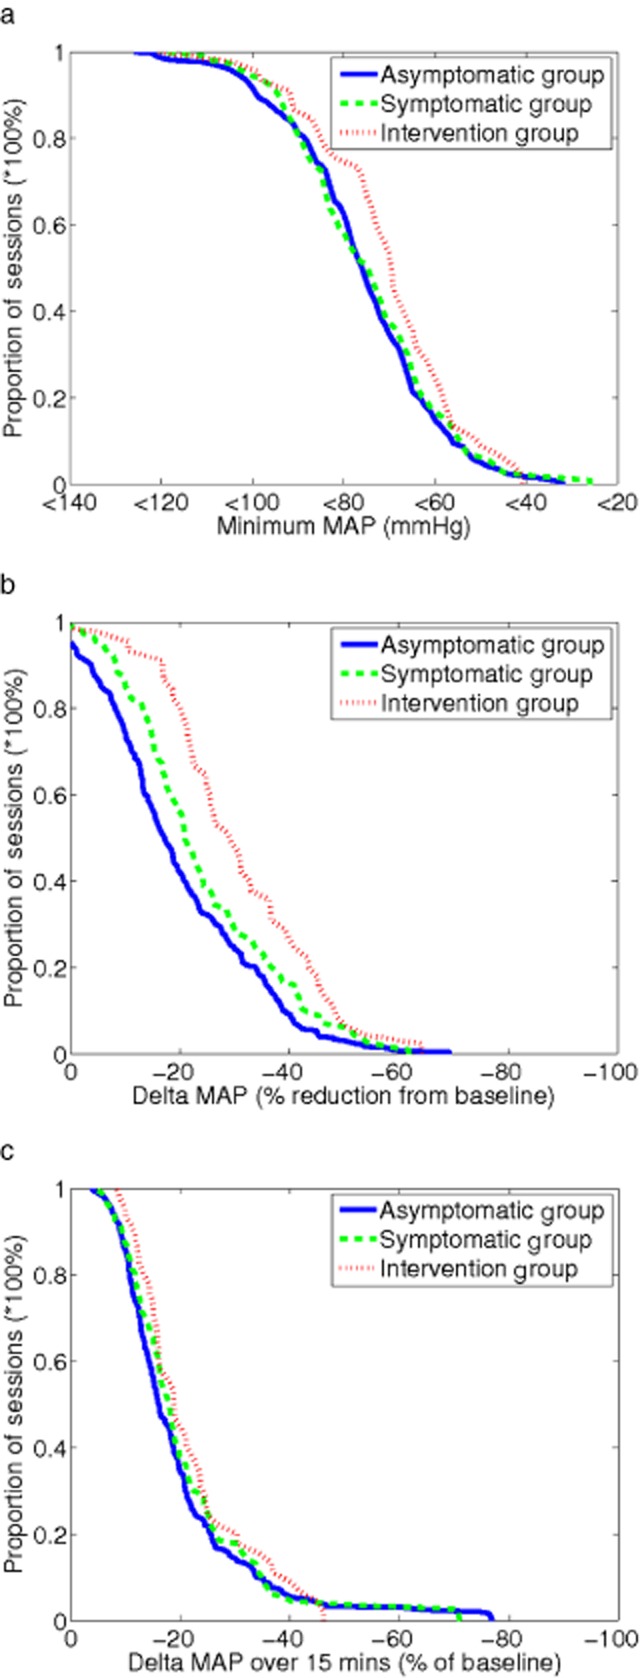
Figure 2.

Cumulative frequency profiles for various mean arterial blood pressure (MAP) metrics used to describe intradialytic hypotension in asymptomatic, symptomatic, and intervention groups. Panel (a) shows lowest (nadir) MAP during dialysis. Panel (b) shows delta MAP (Baseline MAP − Nadir MAP) as a percentage of baseline MAP. Panel (c) shows fall in MAP between two consecutive measurements as a percentage of baseline MAP.
