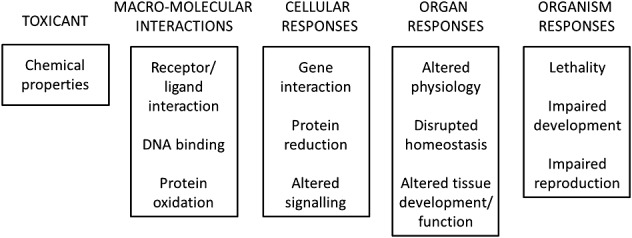
Figure 1.

Schematic representation of the Adverse Outcome Pathways (AOP) with reference to examples of different pathways (adapted from an OECD figure, found at http://www.oecd.org/chemicalsafety/testing/adverse-outcome-pathways-molecular-screening-and-toxicogenomics.htm).
