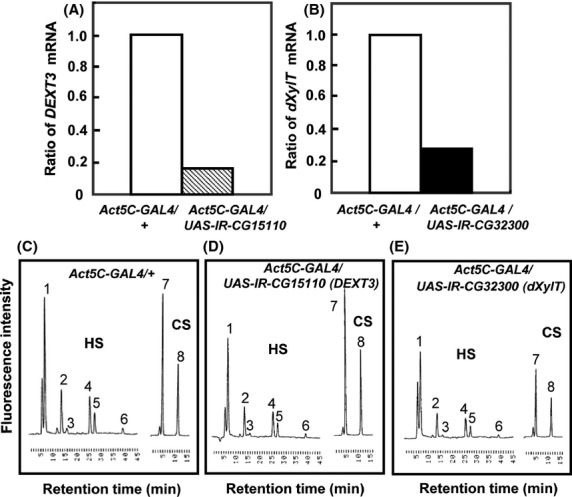
Figure 2.

Reduction in mRNA and GAG levels by silencing of CG15110 (Dext3) and CG32300 (dXylT). (A, B) The mRNA levels of CG15110 and CG32300 in Act5C-GAL4/UAS-IR-CG15110 (A), Act5C-GAL4/UAS-IR-CG17772 (B), and Actin5C-GAL4/+ (as control in A and B) were quantified by real-time PCR. (C–E) Typical chromatograms of GAG-derived oligosaccharides in the third instar larvae of Actin5C-GAL4/+ (C), Act5C-GAL4/UAS-IR-CG15110 (D), and Act5C-GAL4/UAS-IR-CG17772 (E). HS, chromatograms of unsaturated disaccharides from heparan sulfate. CS, chromatograms of unsaturated disaccharides from low-sulfated chondroitin 4-sulfate. Peaks: 1, ΔUA-GlcNAc; 2, ΔUA-GlcNS; 3, ΔUA-GlcNAc6S; 4, ΔUA-GlcNS6S; 5, ΔUA2S-GlcNS; 6, ΔUA2S-GlcNS6S; 7, ΔDi-0S; and 8, ΔDi-4S. The peak heights in each chromatogram reflect the amount of oligosaccharides and can be compared between different genotypes.
