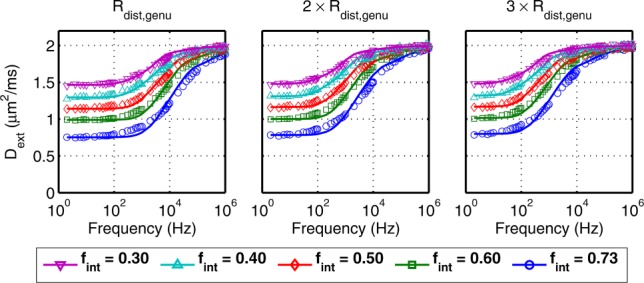
Figure 7.

Simulated (markers) and predicted (–) EAS diffusion spectra for randomly packed cylinders over a range of five cylinder volume fractions
 and cylinders with radius distributions that are one, two, and three times those of axons in the genu (left to right).
