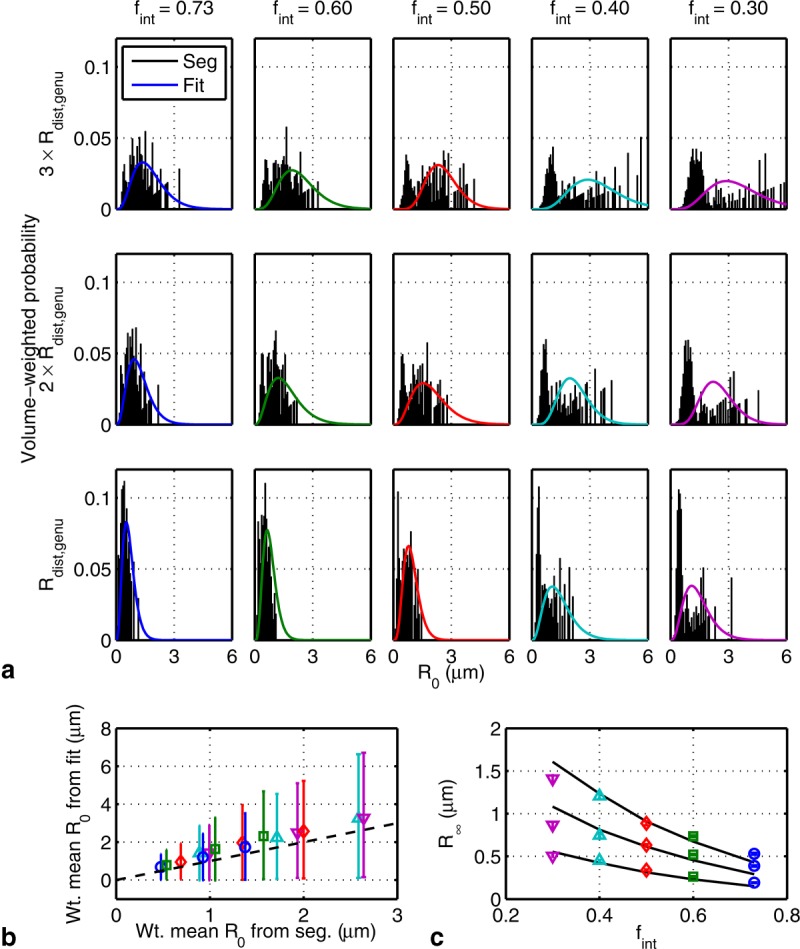
Figure 8.

a: Distribution from segmentation (bars) and prediction (–) for model parameter R0 weighted by cylinder volume fraction. b: The mean and standard deviations of the volume-weighted R0 distributions from fitting versus segmentation corresponding to those in a. c: Fitted (mean ± SD; markers) and predicted (–) model parameter for randomly packed cylinders. The curves denote radius distributions that are three, two, and one times those of axons in the genu (top to bottom). The markers are as in Figure 7.
