
Figure 2.
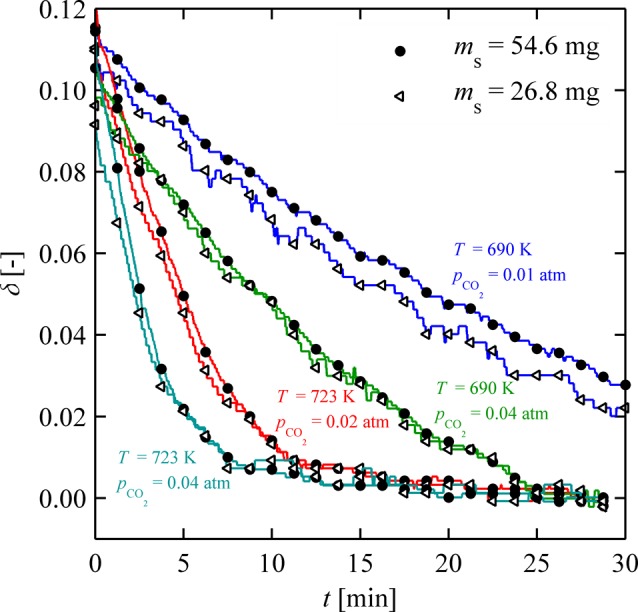
Isothermal weight relaxation curves of ceria oxidation for two different sample masses of 26.8 mg (white triangles) and 54.6 mg (black circles) at different temperatures and CO2 concentrations.
Official websites use .gov
A
.gov website belongs to an official
government organization in the United States.
Secure .gov websites use HTTPS
A lock (
) or https:// means you've safely
connected to the .gov website. Share sensitive
information only on official, secure websites.
Isothermal weight relaxation curves of ceria oxidation for two different sample masses of 26.8 mg (white triangles) and 54.6 mg (black circles) at different temperatures and CO2 concentrations.