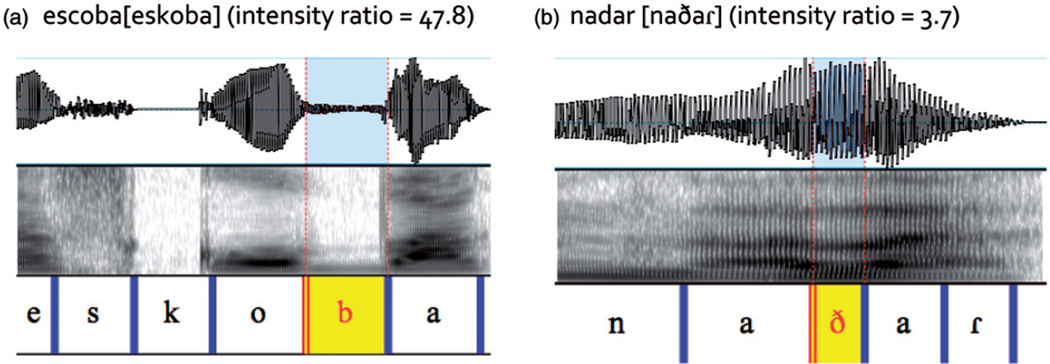
Figure 10.
Examples of highest and lowest intensity ratios for acoustic analysis. Waveforms and spectrograms of the two words with the highest (a) and lowest (b) intensity ratios. The intensity ratio measure was expected to correlate with degree of constriction, so high ratios should be stop-like and low ratios should be fricative-like. Orthographic segmentations of the spectrograms are given, and the target consonant is outlined in black.

