Figure 3.
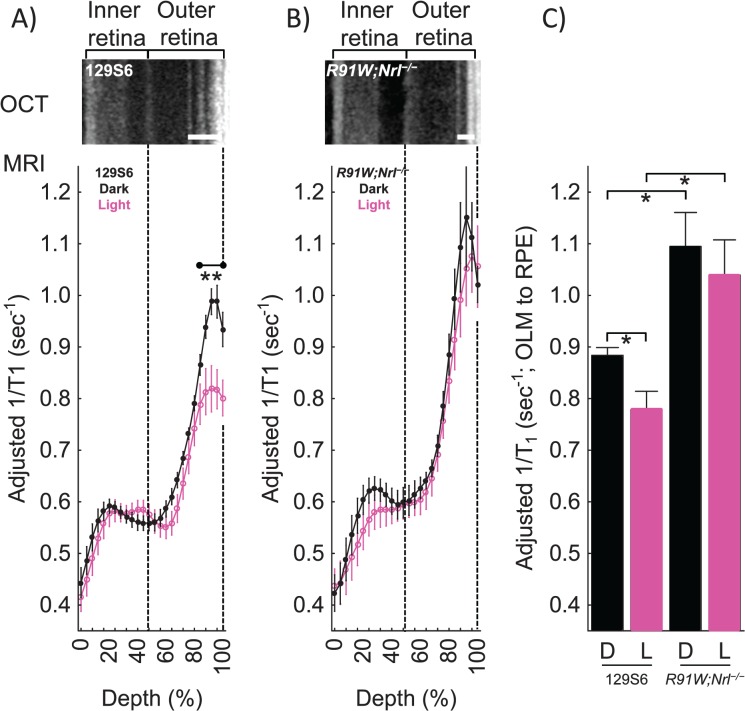
Quench-assisted MRI measurement of healthy outer retina free radical production in vivo. (A) Magnetic resonance imaging profiles from 129S6 mice exposed in a paired-fashion to dark (n = 7) then light (n = 7) inside the magnet. (B) Magnetic resonance imaging profiles from cone-only R91W;Nrl−/− double transgenic mice exposed in a paired-fashion to dark (n = 5) then light (n = 5) inside the magnet. Adjusted 1/T1 data at each depth used factors that normalize same-day 129S6 controls to a 129S6 reference data set. Graphs are otherwise presented using the conventions of Figure 2B. **Retinal depth range with significant difference (P < 0.05). (C) Bar graph summary of 1/T1 data in dark (D) and light (L) averaged over the regions spanning the outer limiting membrane (OLM) to the RPE in 129S6 and R91W;Nrl−/− mice based on their OCT data; these regions are indicated by the heavy white lines on the respective OCT images. *Significant difference (P < 0.05).

