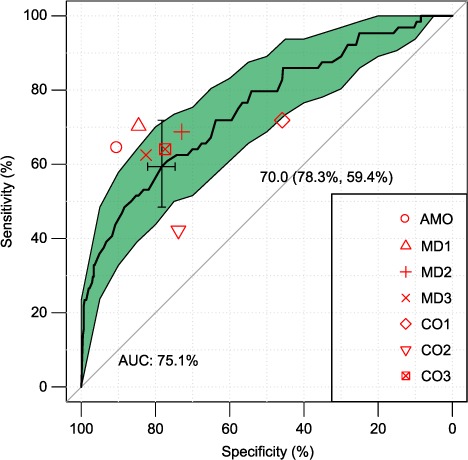
FIGURE 3.

Receiver operated curve17 showing diagnostic performance. The bold line shows the sensitivity/specificity of CAD4TB when using different thresholds for the abnormality score. The cross represents an exemplary cut-off of 70, with resulting specificity/sensitivity in parentheses. AUC = area under the curve; shaded area = confidence interval; CAD4TB = Computer Aided Detection for Tuberculosis.
