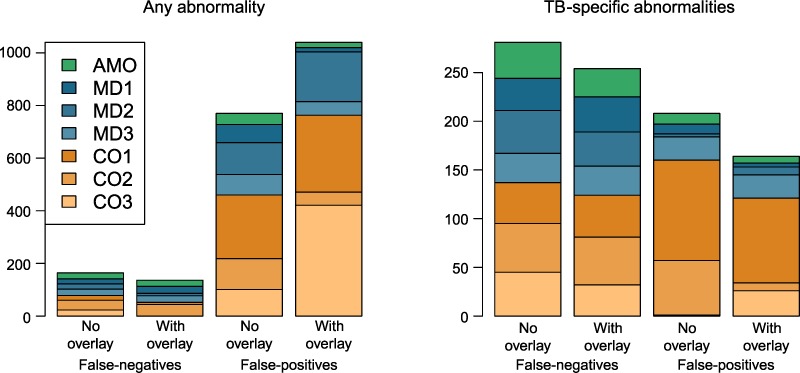
FIGURE 4.

Effect of overlay on false-negatives and false-positives. Stacked barplot shows number of false-negatives and false-positives of individual readers compared to the radiological reference. The left subplot uses the classification ‘any abnormality’ (category 1 vs. 2+3+4); the right subplot uses the classification ‘TB specific abnormalities’ (categories 1+2 vs. 3+4). The height of the barplot represents the number of misclassified images. TB = tuberculosis; AMO = assistant medical officer; CO = clinical officer; MD = medical doctor.
