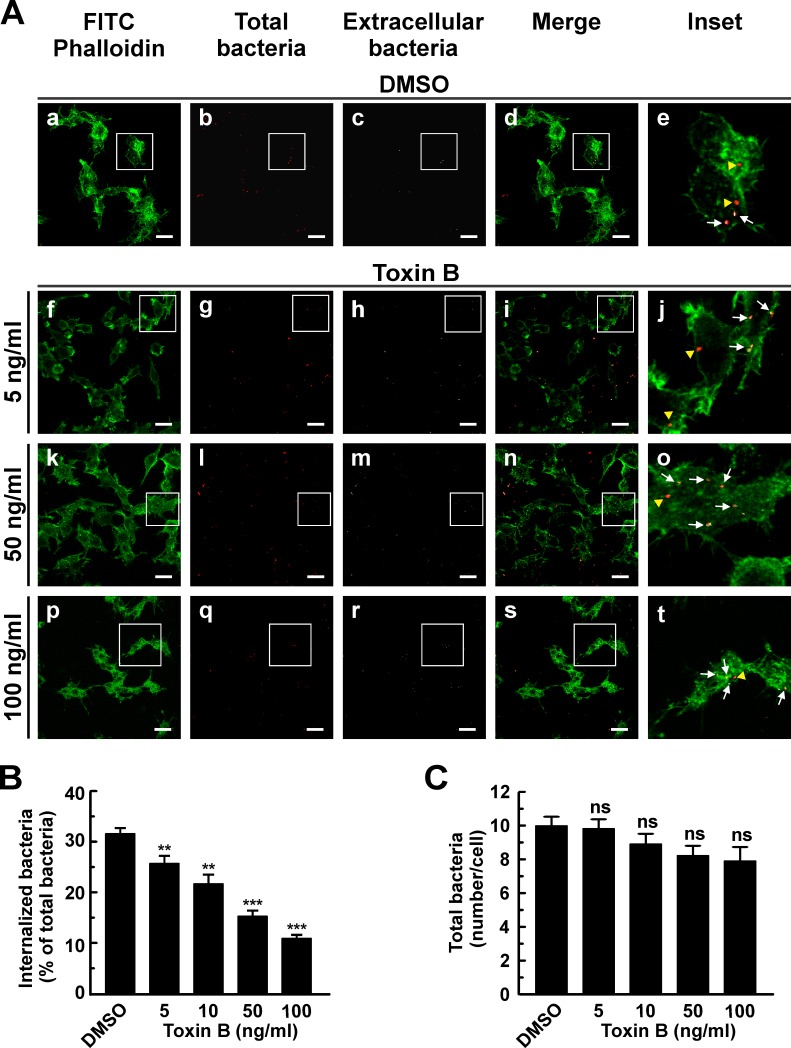
Fig 2. Clostridium difficile toxin B diminishes internalization of C. burnetii by RAW macrophages.
(A) RAW cells were infected with C. burnetii for 4 h at 37°C in the presence of 0.05% DMSO (control, panels a-e) or different concentrations of Clostridium difficile toxin B (panels f-t). Cells were fixed and processed for indirect immunofluorescence to determine C. burnetii internalization and F-actin distribution as described in Materials and Methods. Cells were analyzed by confocal microscopy. Micrographs of representative cells are shown. As indicated in Fig 1, extracellular and total bacteria were stained in white pseudo color (panels c, h, m, and r) and red pseudo color (panels b, g, l, and q), respectively. In the merged images (panels d, i, n, and s) and the insets of the merged images (panels e, j, o, and t), extracellular C. burnetii is shown in white and red pseudo colors (arrows), while intracellular C. burnetii is shown in red pseudo color (yellow arrowheads). F-actin was labeled with phalloidin-FITC (green). Bar scale: 10 μm. (B) Quantification of C. burnetii internalized in control and toxin-treated RAW cells. (C) Quantification of total C. burnetii associated to control or toxin-treated cells. Between 100 and 120 cells and 1200 and 1600 bacteria were counted in each experiment. Results are expressed as means ± SE of three independent experiments. **p < 0.01, ***p < 0.001, compared to DMSO treatment (one-way ANOVA and Dunnett's post hoc test). ns: non-significant differences between groups (p > 0.05).

