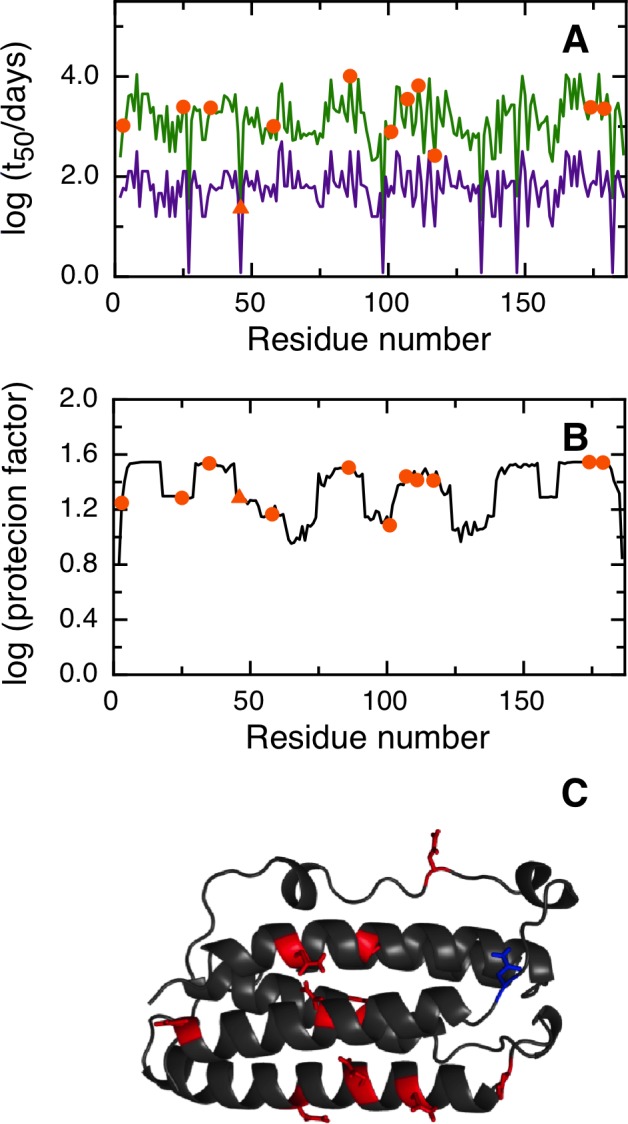
Fig 5. Prediction of asparagine deamidation for the interferon beta protein using NGOME and sequence-only methods.

The symbols highlight asparagine residues, while the lines are the predictions for all positions of the query sequence, in the hypothetical case that they were occupied by an asparagine. The triangles highlight the fastest deamidating asparagine residues according to experiment. (A) t50(NGOME) (green line) and t50(sequence) (purple line) as a function of residue number.(B) Protection factor as a function of residue number. (C) Cartoon structure representation of the interferon beta protein. Asparagine side chains are highlighted (deamidation sites in blue, other sites in red).
