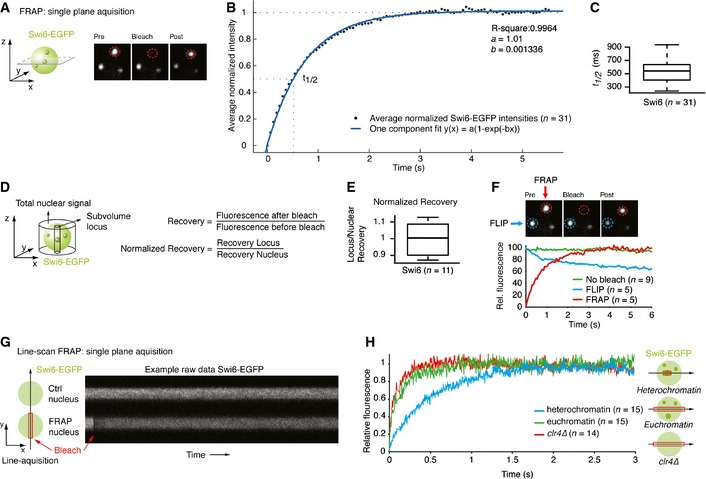
Schematic of single‐plane acquisition FRAP on endogenously tagged Swi6‐EGFP. Representative still images of a FRAP experiment are shown. See also
Movie EV1. Green sphere: yeast nucleus containing Swi6‐EGFP; green dots: heterochromatic Swi6‐EGFP; red circle: bleached area.
Normalized average intensities (black dots) of FRAP on Swi6‐EGFP heterochromatic loci (n = 31) fitted to a one‐component model (blue line). The dashed lines indicate the final relative intensity that is set to 1 and the fluorescence half‐recovery time (t
1/2).
Fluorescence t
1/2 values of FRAP on Swi6‐EGFP heterochromatic loci. The box bounds the interquartile range (IQR) divided by the median, and whiskers extend to a maximum of 1.5 × IQR beyond the box.
Schematic indicating the volumes measured to calculate the normalized fluorescence recovery of a locus relative to the entire nucleus.
Normalized fluorescence recovery values of FRAP on Swi6‐EGFP heterochromatic loci. The box bounds the interquartile range (IQR) divided by the median, and whiskers extend to a maximum of 1.5 × IQR beyond the box.
FLIP experiment showing a bleached (FRAP, red circle) and unbleached, adjacent locus (FLIP, blue circle) in the same nucleus. The graph displays average relative fluorescence of FLIP (blue), FRAP (red), and control loci (no bleach, green) in other non‐bleached cells.
Schematic of a line‐scan FRAP experiment. Fluorescence intensities are measured along a line of a non‐bleached nucleus (Ctrl nucleus) and a bleached nucleus (FRAP nucleus) in Swi6‐EGFP
clr4∆ cells. Red box: bleached region. Right: raw data example.
Average relative intensities of a line‐scan FRAP experiment on Swi6‐EGFP in heterochromatin (blue line), euchromatin (green line), and clr4∆ (red line). The curves have a gliding average of 40.

