-
A
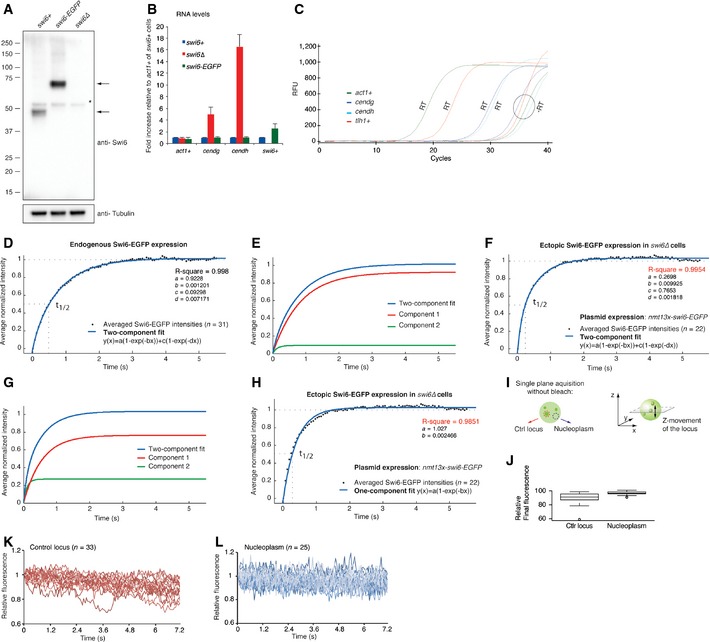
Western blot showing protein levels of endogenous Swi6 and Swi6‐EGFP (denoted by arrows). The blot was probed sequentially with antibodies recognizing Swi6 and tubulin, which serves as a loading control. The asterisk indicates an unspecific band.
-
B
Fold increase in cendg, cendh, and swi6+ RNA levels in swi6‐EGFP and swi6Δ cells compared with wild‐type cells, relative to act1+ mRNA. Error bars denote s.d. from three independent experiments.
-
C
Representative plot of real‐time PCR amplification curves obtained for act1+, cendg, cendh, and tlh1+ cDNA (RT) generated from RNA that was isolated from wild‐type cells. –RT serves as a DNA contamination control (no reverse transcriptase added to the cDNA synthesis reaction). RFU, relative fluorescence units.
-
D
Two‐component fit (blue line) of normalized average FRAP intensities (black dots) obtained for endogenously tagged Swi6‐EGFP at heterochromatic loci. Dashed lines indicate the final relative fluorescence intensity that is set to 1 and the fluorescence half‐recovery time (t
1/2).
-
E
Plot of individual components of the FRAP curve fit in (A). Component 1: a(1‐exp(‐bx)), Component 2: c(1‐exp(‐dx)).
-
F
Two‐component fit (blue line) of normalized average FRAP intensities (black dots) obtained for plasmid‐borne ectopically expressed Swi6‐EGFP at heterochromatic loci.
-
G
Plot of individual components of the curve fit in (D). Component 1: a(1−exp(−bx)), Component 2: c(1−exp(−dx)).
-
H
One‐component fit (blue line) of normalized average FRAP intensities (black dots) obtained for plasmid‐borne ectopically expressed Swi6‐EGFP at heterochromatic loci.
-
I
Schematics of a single‐plane acquisition of a heterochromatic Swi6‐EGFP locus (red, control locus) and a region in the nucleoplasm (blue). Movement of the locus out of the focal plane is depicted on the right.
-
J
Relative final fluorescence signal after photobleaching obtained for heterochromatic and nucleoplasmic Swi6‐EGFP. The box bounds the interquartile range (IQR) divided by the median, and whiskers extend to a maximum of 1.5 × IQR beyond the box.
-
K, L
Relative fluorescence of heterochromatic Swi6‐EGFP (red) (K) and nucleoplasmic Swi6‐EGFP (blue) (L) acquired on a single plane in living cells over time. Fluorescence intensity at the beginning of image acquisition was set to 1.

