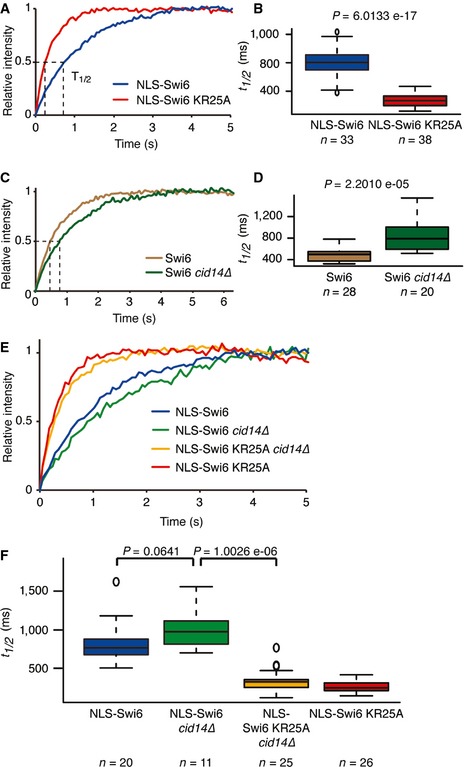
Figure 2. RNA decelerates Swi6 dynamics.

-
A, BAverage relative intensities over time and corresponding fluorescence t 1/2 values of heterochromatic Swi6 obtained from FRAP experiments performed with cells expressing NLS‐Swi6‐EGFP (blue) or NLS‐Swi6‐KR25A‐EGFP (red).
-
C, DAverage relative intensities over time and corresponding fluorescence t 1/2 values of heterochromatic Swi6 obtained from FRAP experiments performed with wild‐type (brown) or cid14∆ (dark green) cells expressing Swi6‐EGFP.
-
E, FAverage relative intensities over time and corresponding fluorescence t 1/2 values of heterochromatic Swi6 obtained from FRAP experiments performed with wild‐type cells expressing heterochromatic NLS‐Swi6‐EGFP (blue) or NLS‐Swi6 KR25A‐EGFP (red), or cid14∆ cells expressing NLS‐Swi6‐EGFP (green) or NLS‐Swi6‐KR25A‐EGFP (yellow).
