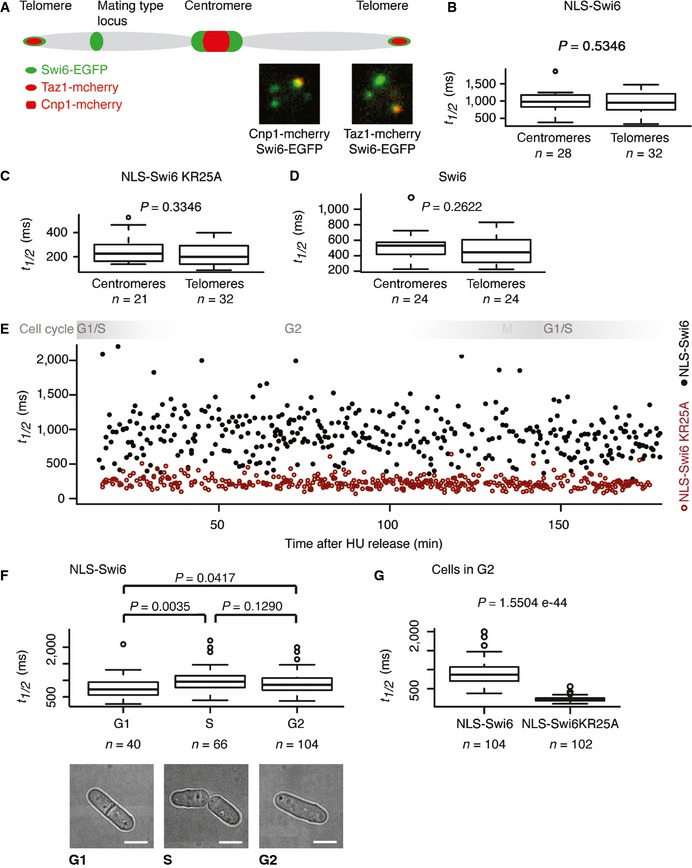
Schematic of a chromosome indicating Swi6‐EGFP heterochromatic domains (green). Cnp1‐mCherry and Taz1‐mCherry (red) mark centromeres and telomeres, respectively. Representative images demonstrating Swi6‐EGFP co‐localization with centromeres (Cnp1‐mCherry) and telomeres (Taz1‐mCherry) are shown.
Fluorescence t
1/2 values of centromeric or telomeric Swi6 obtained from FRAP experiments performed with cells expressing NLS‐Swi6‐EGFP.
Fluorescence t
1/2 values of centromeric or telomeric Swi6 obtained from FRAP experiments performed with cells expressing the RNA‐binding mutant NLS‐Swi6‐KR25A‐EGFP.
Fluorescence t
1/2 values of centromeric or telomeric Swi6 obtained from FRAP experiments performed with cells expressing Swi6‐EGFP.
Fluorescence t
1/2 values of centromeric Swi6 obtained from FRAP experiments performed after release of cells expressing NLS‐Swi6‐EGFP (black dots) or the RNA‐binding mutant NLS‐Swi6‐KR25A‐EGFP (red dots) from G1/S cell cycle arrest. Each dot represents one FRAP experiment at the respective time after release from cell cycle arrest. Swi6 is dispersed in M phase due to H3S10 phosphorylation, and M phase was therefore not included in the FRAP analysis.
Fluorescence t
1/2 values obtained from FRAP experiments performed on centromeric Swi6. A total of 40, 66, and 104 individual cells residing in the G1, S, and G2 phases of the cell cycle were analyzed, respectively. Representative bright‐field images of cells in G1, S, or G2 are shown. Scale bars = 2 μm.
Fluorescence t
1/2 values obtained from FRAP experiments performed on centromeric Swi6 of cells expressing NLS‐Swi6‐EGFP and NLS‐Swi6‐KR25A‐EGFP that reside in the G2 of the cell cycle.
Data information: In (B–D), (F) and (G), the box bounds the interquartile range (IQR) divided by the median, and whiskers extend to a maximum of 1.5 × IQR beyond the box.

