-
A, B
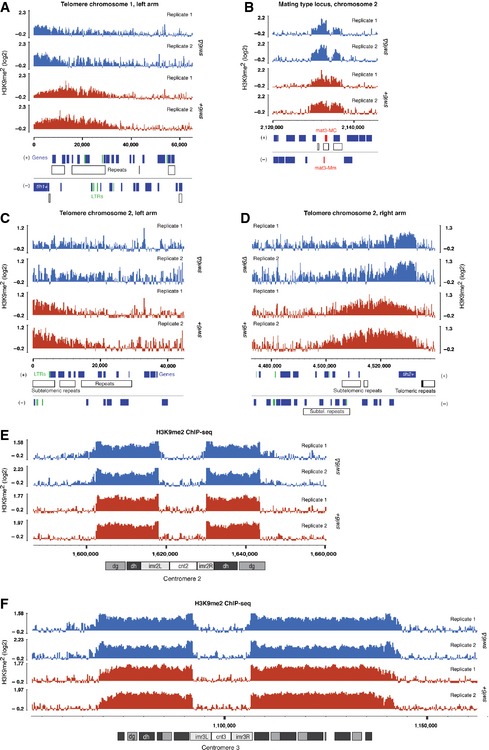
H3K9me2 ChIP‐seq enrichment profiles for swi6+ (red) and swi6∆ (blue) cells at the telomere of the left arm of chromosome 1 (A) and the silent mating type locus on chromosome 2 (B).
-
C, D
H3K9me2 ChIP‐seq enrichment profiles for swi6+ (red) and swi6∆ (blue) cells at the telomeres of the left (C) and right (D) arms of chromosome 2.
-
E, F
H3K9me2 ChIP‐seq enrichment profiles for swi6+ (red) and swi6∆ (blue) cells at centromere 2 (E) and centromere 3 (F).
Data information: The
y‐axes represent log
2 ChIP‐seq enrichments in 200‐bp genomically tiled windows calculated over
clr4Δ cells. Two independent biological replicates for each genotype were performed (replicates 1 and 2). Positions of genomic elements on the plus and minus strands are indicated. Blue, protein‐coding genes; white, repeats; green, long terminal repeat (LTR).

